Node information
Test timing information
Up ramp statistics
Runtime session statistics
Down ramp statistics
Overall statistics
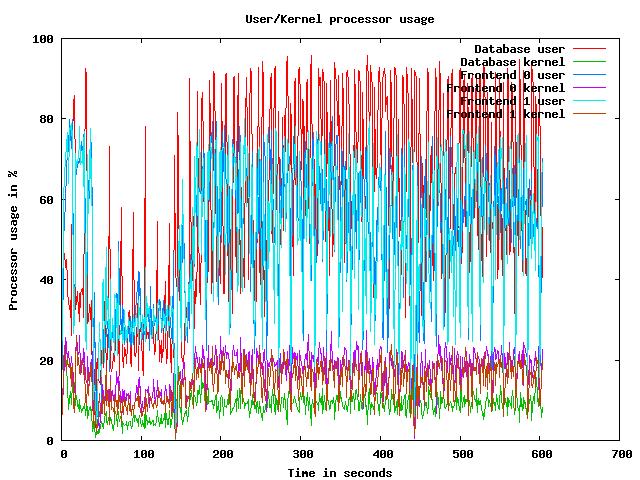
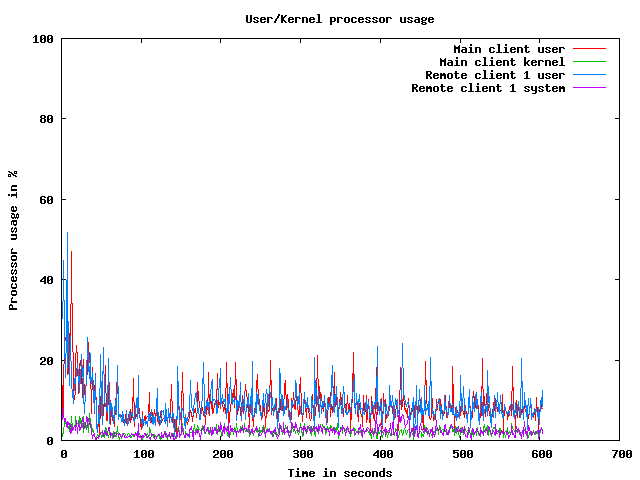
CPU usage graphs
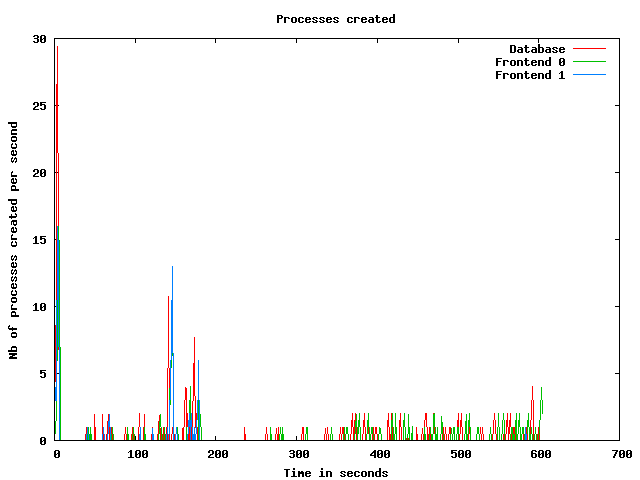
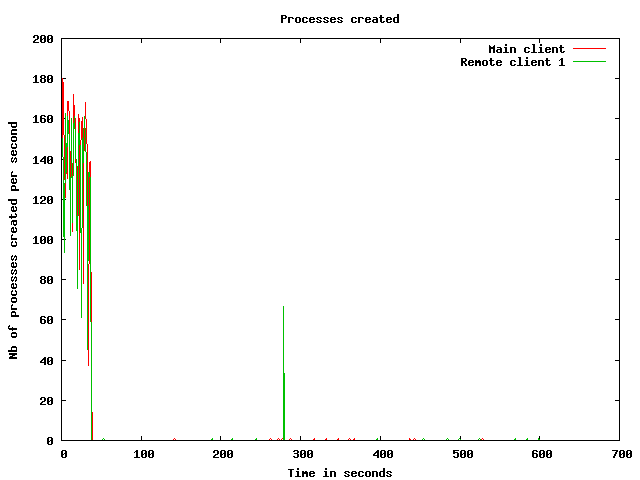
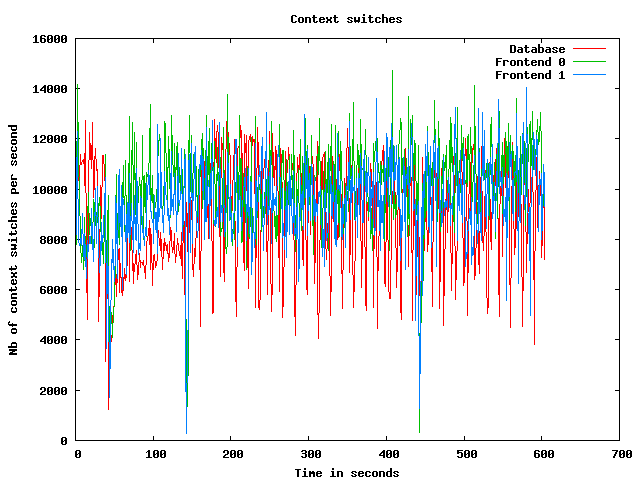
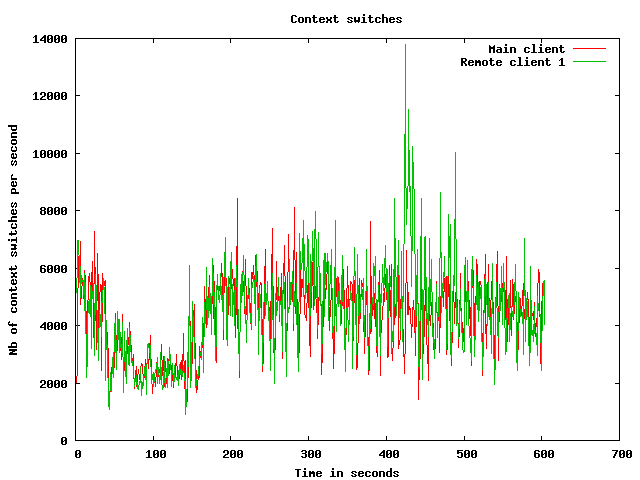
Processes usage graphs
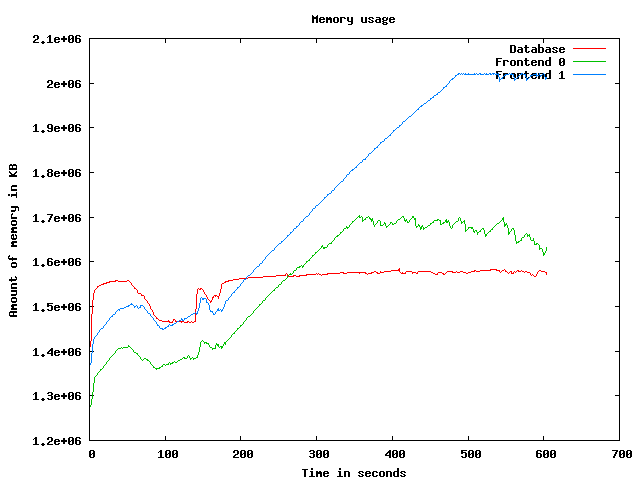
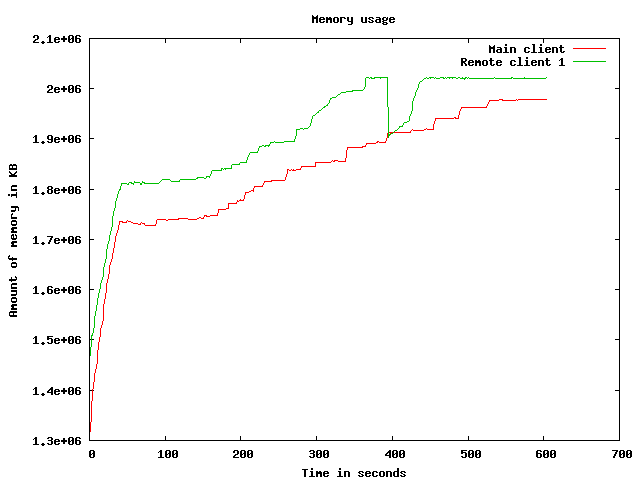
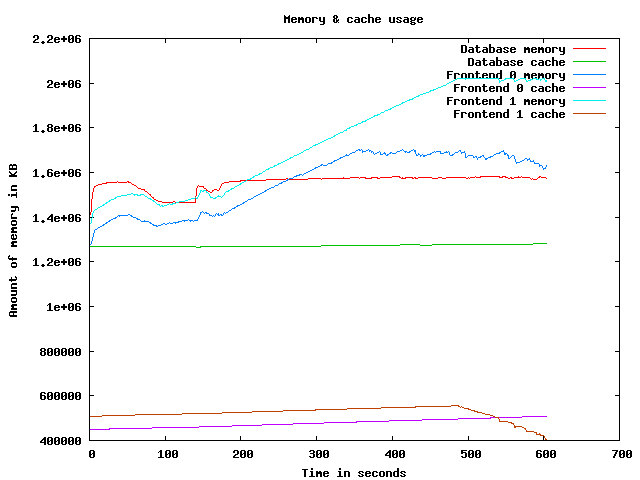
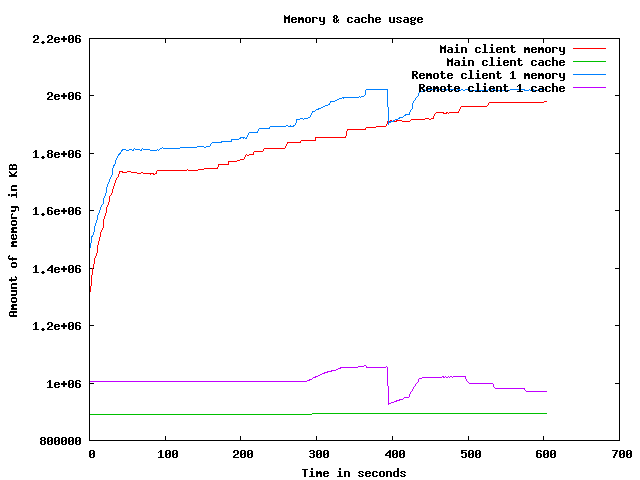
Memory usage graph
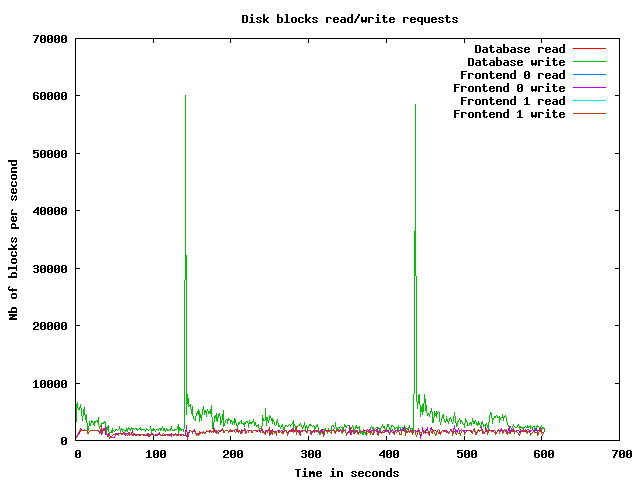
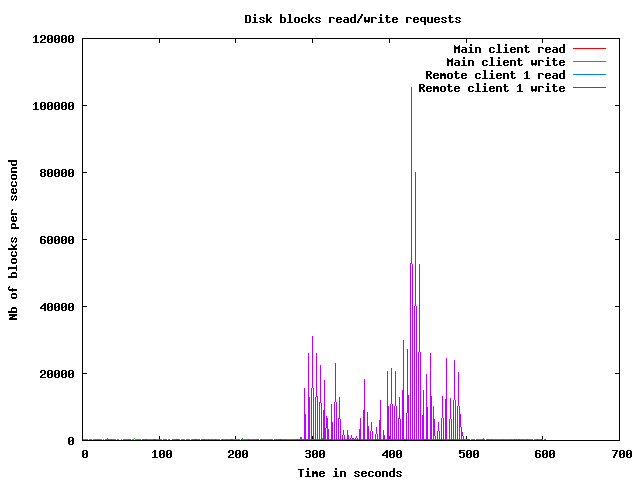
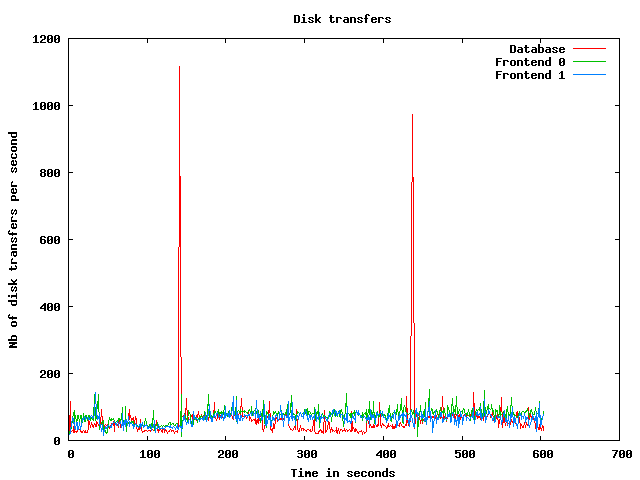
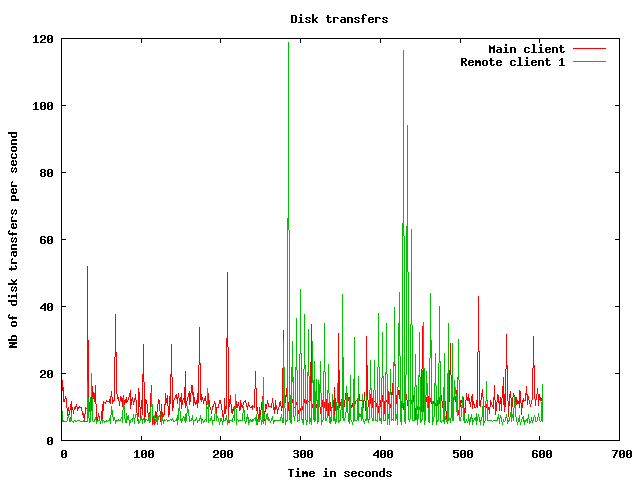
Disk usage graphs
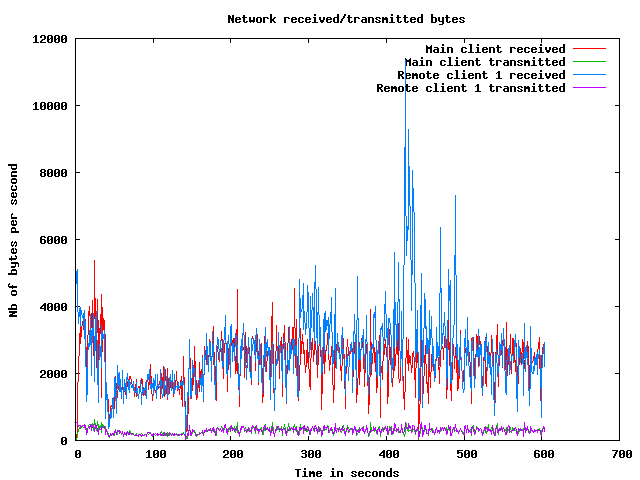
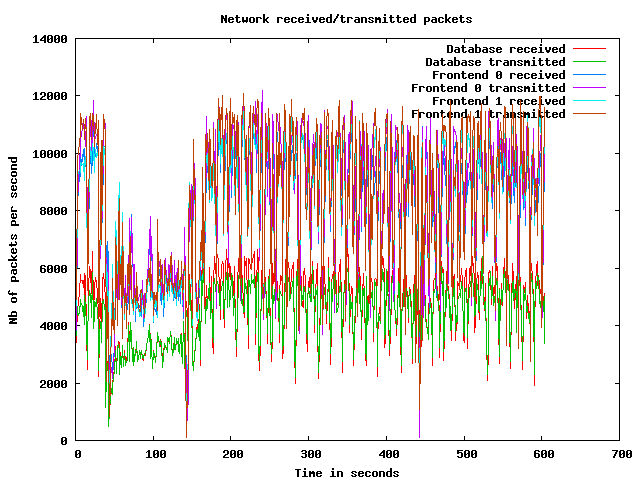
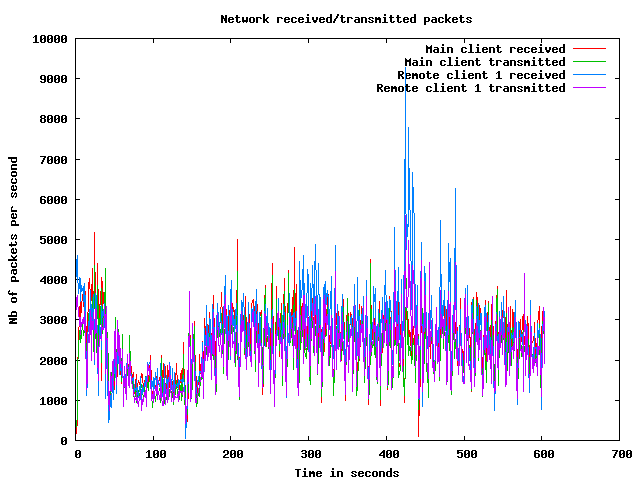
Network usage graphs
| Test start | 2009-3-20 1:38:22 |
| Up ramp start | 2009-3-20 1:39:2 |
| Runtime session start | 2009-3-20 1:41:2 |
| Down ramp start | 2009-3-20 1:48:32 |
| Test end | 2009-3-20 1:51:22 |
| Up ramp length | 2 minutes 1 millisecond (requested 120000 ms) |
| Runtime session length | 7 minutes 30 seconds 0 millisecond (requested 450000 ms) |
| Down ramp length | 30 seconds 0 millisecond (requested 30000 ms) |
| Total test length | 12 minutes 59 seconds 972 milliseconds |
| State name | % of total | Count | Errors | Minimum Time | Maximum Time | Average Time |
|---|---|---|---|---|---|---|
Home | 9 % | 8560 | 0 | 0 ms | 93248 ms | 6903 ms
|
Register | 1 % | 1206 | 0 | 0 ms | 93297 ms | 2955 ms
|
RegisterUser | 1 % | 1121 | 36 | 5 ms | 93315 ms | 2138 ms
|
Browse | 9 % | 8640 | 0 | 0 ms | 93278 ms | 2888 ms
|
BrowseCategories | 6 % | 5737 | 0 | 3 ms | 93275 ms | 1993 ms
|
SearchItemsInCategory | 14 % | 13345 | 0 | 3 ms | 93136 ms | 1764 ms
|
BrowseRegions | 2 % | 2409 | 0 | 3 ms | 93309 ms | 2259 ms
|
BrowseCategoriesInRegion | 2 % | 2249 | 0 | 3 ms | 93229 ms | 1982 ms
|
SearchItemsInRegion | 5 % | 4617 | 0 | 0 ms | 93280 ms | 1794 ms
|
ViewItem | 12 % | 11468 | 0 | 3 ms | 93265 ms | 1665 ms
|
ViewUserInfo | 2 % | 2064 | 0 | 3 ms | 93004 ms | 1615 ms
|
ViewBidHistory | 1 % | 1080 | 0 | 3 ms | 46012 ms | 1605 ms
|
BuyNowAuth | 1 % | 991 | 0 | 2 ms | 45480 ms | 1388 ms
|
BuyNow | 0 % | 884 | 125 | 3 ms | 45171 ms | 1134 ms
|
StoreBuyBow | 0 % | 659 | 0 | 4 ms | 45021 ms | 1040 ms
|
PutBidAuth | 4 % | 3912 | 0 | 0 ms | 93013 ms | 1528 ms
|
PutBid | 4 % | 3862 | 456 | 1 ms | 93023 ms | 1449 ms
|
StoreBid | 2 % | 2291 | 1 | 4 ms | 65152 ms | 1574 ms
|
PutCommentAuth | 0 % | 0 | 0 | 0 ms | 0 ms | 0 ms
|
PutComment | 0 % | 347 | 43 | 4 ms | 45790 ms | 1768 ms
|
StoreComment | 0 % | 258 | 0 | 4 ms | 45713 ms | 1557 ms
|
Sell | 0 % | 702 | 0 | 0 ms | 93013 ms | 2443 ms
|
SelectCategoryToSellItem | 0 % | 642 | 0 | 4 ms | 93026 ms | 1743 ms
|
SellItemForm | 0 % | 594 | 0 | 2 ms | 93069 ms | 2154 ms
|
RegisterItem | 0 % | 530 | 0 | 4 ms | 93162 ms | 2016 ms
|
AboutMe (auth form) | 2 % | 1938 | 0 | 0 ms | 93010 ms | 2976 ms
|
AboutMe | 3 % | 2827 | 0 | 4 ms | 93060 ms | 2045 ms
|
Back probability | 7 % | 7254 | 0 | 0 ms | 0 ms | 0 ms
|
End of Session | 1 % | 980 | 0 | 0 ms | 0 ms | 0 ms
|
Total | 100 % | 91167 | 661 | - | - | 2214 ms
|
Average throughput | 765 req/s
| |||||
Completed sessions | 881
| |||||
Total time | 51448 seconds
| |||||
Average session time | 58 seconds
| |||||
| State name | % of total | Count | Errors | Minimum Time | Maximum Time | Average Time |
|---|---|---|---|---|---|---|
Home | 4 % | 12705 | 0 | 0 ms | 235628 ms | 872 ms
|
Register | 1 % | 3102 | 0 | 0 ms | 193579 ms | 1754 ms
|
RegisterUser | 1 % | 3057 | 129 | 5 ms | 211792 ms | 2050 ms
|
Browse | 7 % | 21334 | 0 | 0 ms | 284547 ms | 1994 ms
|
BrowseCategories | 4 % | 14965 | 0 | 3 ms | 383486 ms | 2024 ms
|
SearchItemsInCategory | 15 % | 47221 | 0 | 3 ms | 382978 ms | 2050 ms
|
BrowseRegions | 2 % | 6095 | 0 | 3 ms | 380007 ms | 2065 ms
|
BrowseCategoriesInRegion | 1 % | 5991 | 0 | 3 ms | 249665 ms | 2065 ms
|
SearchItemsInRegion | 5 % | 15537 | 0 | 0 ms | 284687 ms | 2073 ms
|
ViewItem | 14 % | 43237 | 0 | 3 ms | 286864 ms | 2019 ms
|
ViewUserInfo | 3 % | 10015 | 0 | 3 ms | 249683 ms | 2015 ms
|
ViewBidHistory | 1 % | 5367 | 0 | 3 ms | 284788 ms | 2454 ms
|
BuyNowAuth | 1 % | 4062 | 0 | 2 ms | 284066 ms | 1996 ms
|
BuyNow | 1 % | 3999 | 524 | 4 ms | 286569 ms | 2131 ms
|
StoreBuyBow | 1 % | 3420 | 2 | 5 ms | 213430 ms | 1563 ms
|
PutBidAuth | 4 % | 15207 | 0 | 0 ms | 383466 ms | 1983 ms
|
PutBid | 5 % | 17732 | 1883 | 2 ms | 283820 ms | 2120 ms
|
StoreBid | 3 % | 11677 | 11 | 5 ms | 380026 ms | 2098 ms
|
PutCommentAuth | 0 % | 0 | 0 | 0 ms | 0 ms | 0 ms
|
PutComment | 0 % | 1498 | 115 | 5 ms | 101130 ms | 1749 ms
|
StoreComment | 0 % | 1363 | 0 | 5 ms | 213467 ms | 2162 ms
|
Sell | 0 % | 1631 | 0 | 0 ms | 211774 ms | 2363 ms
|
SelectCategoryToSellItem | 0 % | 1618 | 0 | 5 ms | 193653 ms | 1697 ms
|
SellItemForm | 0 % | 1597 | 0 | 2 ms | 194004 ms | 2278 ms
|
RegisterItem | 0 % | 1585 | 0 | 4 ms | 379993 ms | 1911 ms
|
AboutMe (auth form) | 1 % | 5076 | 0 | 0 ms | 235578 ms | 2117 ms
|
AboutMe | 2 % | 8640 | 0 | 5 ms | 383741 ms | 2374 ms
|
Back probability | 10 % | 32351 | 0 | 0 ms | 0 ms | 0 ms
|
End of Session | 1 % | 4525 | 0 | 0 ms | 0 ms | 0 ms
|
Total | 100 % | 304607 | 2664 | - | - | 1740 ms
|
Average throughput | 682 req/s
| |||||
Completed sessions | 4547
| |||||
Total time | 1228539 seconds
| |||||
Average session time | 270 seconds
| |||||
| State name | % of total | Count | Errors | Minimum Time | Maximum Time | Average Time |
|---|---|---|---|---|---|---|
Home | 3 % | 448 | 0 | 0 ms | 210996 ms | 2314 ms
|
Register | 1 % | 144 | 0 | 0 ms | 100169 ms | 2393 ms
|
RegisterUser | 1 % | 136 | 2 | 5 ms | 45854 ms | 826 ms
|
Browse | 6 % | 785 | 0 | 0 ms | 190039 ms | 3926 ms
|
BrowseCategories | 4 % | 570 | 0 | 3 ms | 290169 ms | 5296 ms
|
SearchItemsInCategory | 15 % | 1779 | 0 | 3 ms | 283017 ms | 4756 ms
|
BrowseRegions | 2 % | 252 | 0 | 3 ms | 211006 ms | 2890 ms
|
BrowseCategoriesInRegion | 2 % | 245 | 0 | 3 ms | 190062 ms | 3460 ms
|
SearchItemsInRegion | 5 % | 612 | 0 | 0 ms | 237696 ms | 4175 ms
|
ViewItem | 14 % | 1705 | 0 | 3 ms | 290267 ms | 4969 ms
|
ViewUserInfo | 3 % | 382 | 0 | 3 ms | 190008 ms | 3820 ms
|
ViewBidHistory | 1 % | 223 | 0 | 4 ms | 246201 ms | 2530 ms
|
BuyNowAuth | 1 % | 142 | 0 | 2 ms | 190021 ms | 5454 ms
|
BuyNow | 1 % | 125 | 12 | 5 ms | 190094 ms | 5701 ms
|
StoreBuyBow | 1 % | 126 | 0 | 5 ms | 93230 ms | 1987 ms
|
PutBidAuth | 4 % | 575 | 0 | 0 ms | 190023 ms | 3901 ms
|
PutBid | 5 % | 690 | 68 | 4 ms | 211386 ms | 5528 ms
|
StoreBid | 3 % | 454 | 0 | 4 ms | 380013 ms | 4636 ms
|
PutCommentAuth | 0 % | 0 | 0 | 0 ms | 0 ms | 0 ms
|
PutComment | 0 % | 43 | 7 | 3 ms | 21002 ms | 520 ms
|
StoreComment | 0 % | 42 | 0 | 5 ms | 190127 ms | 10224 ms
|
Sell | 0 % | 72 | 0 | 0 ms | 190002 ms | 5591 ms
|
SelectCategoryToSellItem | 0 % | 72 | 0 | 4 ms | 190001 ms | 5030 ms
|
SellItemForm | 0 % | 64 | 0 | 2 ms | 93007 ms | 4711 ms
|
RegisterItem | 0 % | 67 | 0 | 5 ms | 93440 ms | 2147 ms
|
AboutMe (auth form) | 1 % | 185 | 0 | 0 ms | 283008 ms | 5977 ms
|
AboutMe | 2 % | 327 | 0 | 4 ms | 190670 ms | 2867 ms
|
Back probability | 11 % | 1297 | 0 | 0 ms | 0 ms | 0 ms
|
End of Session | 1 % | 163 | 0 | 0 ms | 0 ms | 0 ms
|
Total | 100 % | 11725 | 89 | - | - | 3749 ms
|
Average throughput | 393 req/s
| |||||
Completed sessions | 157
| |||||
Total time | 63681 seconds
| |||||
Average session time | 405 seconds
| |||||
| State name | % of total | Count | Errors | Minimum Time | Maximum Time | Average Time |
|---|---|---|---|---|---|---|
Home | 5 % | 21722 | 0 | 0 ms | 235628 ms | 3340 ms
|
Register | 1 % | 4467 | 0 | 0 ms | 199042 ms | 2282 ms
|
RegisterUser | 1 % | 4324 | 167 | 5 ms | 211792 ms | 2340 ms
|
Browse | 7 % | 30823 | 0 | 0 ms | 284547 ms | 2448 ms
|
BrowseCategories | 5 % | 21304 | 0 | 3 ms | 383486 ms | 2272 ms
|
SearchItemsInCategory | 15 % | 62732 | 0 | 3 ms | 382978 ms | 2271 ms
|
BrowseRegions | 2 % | 8776 | 0 | 3 ms | 380007 ms | 2366 ms
|
BrowseCategoriesInRegion | 2 % | 8502 | 0 | 3 ms | 249665 ms | 2253 ms
|
SearchItemsInRegion | 5 % | 20855 | 0 | 0 ms | 380087 ms | 2263 ms
|
ViewItem | 13 % | 56630 | 0 | 3 ms | 290267 ms | 2224 ms
|
ViewUserInfo | 3 % | 12525 | 0 | 3 ms | 380006 ms | 2208 ms
|
ViewBidHistory | 1 % | 6698 | 0 | 3 ms | 284788 ms | 2470 ms
|
BuyNowAuth | 1 % | 5212 | 0 | 2 ms | 284066 ms | 2151 ms
|
BuyNow | 1 % | 5018 | 663 | 3 ms | 286569 ms | 2227 ms
|
StoreBuyBow | 1 % | 4212 | 2 | 4 ms | 213430 ms | 1742 ms
|
PutBidAuth | 4 % | 19735 | 0 | 0 ms | 383466 ms | 2123 ms
|
PutBid | 5 % | 22396 | 2412 | 1 ms | 283820 ms | 2324 ms
|
StoreBid | 3 % | 14461 | 12 | 4 ms | 380026 ms | 2404 ms
|
PutCommentAuth | 0 % | 0 | 0 | 0 ms | 0 ms | 0 ms
|
PutComment | 0 % | 1891 | 165 | 3 ms | 101130 ms | 1820 ms
|
StoreComment | 0 % | 1665 | 0 | 4 ms | 213467 ms | 2620 ms
|
Sell | 0 % | 2414 | 0 | 0 ms | 211774 ms | 2629 ms
|
SelectCategoryToSellItem | 0 % | 2335 | 0 | 4 ms | 193653 ms | 2015 ms
|
SellItemForm | 0 % | 2262 | 0 | 2 ms | 199006 ms | 2609 ms
|
RegisterItem | 0 % | 2190 | 0 | 4 ms | 379993 ms | 2248 ms
|
AboutMe (auth form) | 1 % | 7209 | 0 | 0 ms | 283008 ms | 2582 ms
|
AboutMe | 2 % | 11893 | 0 | 4 ms | 383741 ms | 2432 ms
|
Back probability | 10 % | 40985 | 0 | 0 ms | 0 ms | 0 ms
|
End of Session | 1 % | 5683 | 0 | 0 ms | 0 ms | 0 ms
|
Total | 100 % | 408919 | 3421 | - | - | 2066 ms
|
Average throughput | 687 req/s
| |||||
Completed sessions | 5683
| |||||
Total time | 1385622 seconds
| |||||
Average session time | 243 seconds
| |||||
An error occured while waiting for remote processes termination (Skipping waits)
Command is: /usr/bin/scp farm6.csail.mit.edu:/tmp/client1 /home/drkp/sandbox/txcache/src/RUBiS-1.4.3/bench/2009-3-20@1:38:22//client1.bin
Command is: /usr/bin/ssh -x localhost /bin/bash -c 'LANG=en_GB.UTF-8 /usr/bin/sar -n DEV -n SOCK -rubcw 1 605 -f /home/drkp/sandbox/txcache/src/RUBiS-1.4.3/bench/2009-3-20@1:38:22//client1.bin > /home/drkp/sandbox/txcache/src/RUBiS-1.4.3/bench/2009-3-20@1:38:22//client1'
Command is: /usr/bin/scp farm14:/tmp/db_server0 /home/drkp/sandbox/txcache/src/RUBiS-1.4.3/bench/2009-3-20@1:38:22//db_server0.bin
Command is: /usr/bin/ssh -x localhost /bin/bash -c 'LANG=en_GB.UTF-8 /usr/bin/sar -n DEV -n SOCK -rubcw 1 605 -f /home/drkp/sandbox/txcache/src/RUBiS-1.4.3/bench/2009-3-20@1:38:22//db_server0.bin > /home/drkp/sandbox/txcache/src/RUBiS-1.4.3/bench/2009-3-20@1:38:22//db_server0'
Command is: /usr/bin/scp farm12.csail.mit.edu:/tmp/web_server0 /home/drkp/sandbox/txcache/src/RUBiS-1.4.3/bench/2009-3-20@1:38:22//web_server0.bin
Command is: /usr/bin/ssh -x localhost /bin/bash -c 'LANG=en_GB.UTF-8 /usr/bin/sar -n DEV -n SOCK -rubcw 1 605 -f /home/drkp/sandbox/txcache/src/RUBiS-1.4.3/bench/2009-3-20@1:38:22//web_server0.bin > /home/drkp/sandbox/txcache/src/RUBiS-1.4.3/bench/2009-3-20@1:38:22//web_server0'
Command is: /usr/bin/scp farm13.csail.mit.edu:/tmp/web_server1 /home/drkp/sandbox/txcache/src/RUBiS-1.4.3/bench/2009-3-20@1:38:22//web_server1.bin
Command is: /usr/bin/ssh -x localhost /bin/bash -c 'LANG=en_GB.UTF-8 /usr/bin/sar -n DEV -n SOCK -rubcw 1 605 -f /home/drkp/sandbox/txcache/src/RUBiS-1.4.3/bench/2009-3-20@1:38:22//web_server1.bin > /home/drkp/sandbox/txcache/src/RUBiS-1.4.3/bench/2009-3-20@1:38:22//web_server1'
Command is: /usr/bin/scp localhost:/tmp/client0 /home/drkp/sandbox/txcache/src/RUBiS-1.4.3/bench/2009-3-20@1:38:22//client0.bin
Command is: /usr/bin/ssh -x localhost /bin/bash -c 'LANG=en_GB.UTF-8 /usr/bin/sar -n DEV -n SOCK -rubcw 1 605 -f /home/drkp/sandbox/txcache/src/RUBiS-1.4.3/bench/2009-3-20@1:38:22//client0.bin > /home/drkp/sandbox/txcache/src/RUBiS-1.4.3/bench/2009-3-20@1:38:22//client0'
Command is: /usr/bin/scp farm6.csail.mit.edu:/tmp/trace_client1.html /home/drkp/sandbox/txcache/src/RUBiS-1.4.3/bench/2009-3-20@1:38:22//
Command is: /usr/bin/scp farm6.csail.mit.edu:/tmp/stat_client1.html /home/drkp/sandbox/txcache/src/RUBiS-1.4.3/bench/2009-3-20@1:38:22//
|
|
|
|
|
|
 | 
|
 | 
|
 | 
|
 | 
|
 | 
|
 | 
|
 | 
|
 | 
|
 | 
|