Node information
Test timing information
Up ramp statistics
Runtime session statistics
Down ramp statistics
Overall statistics
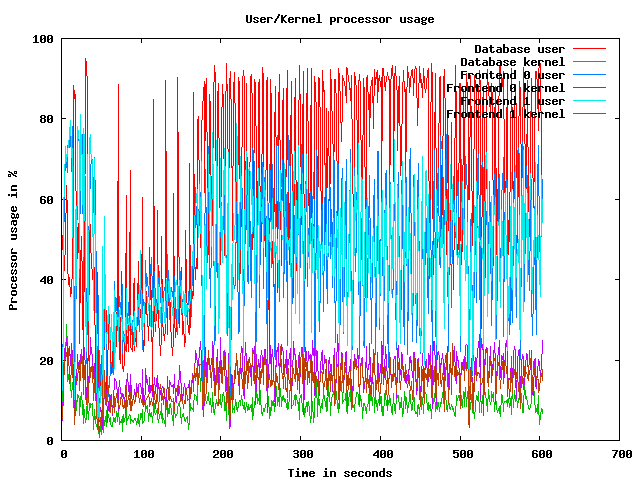
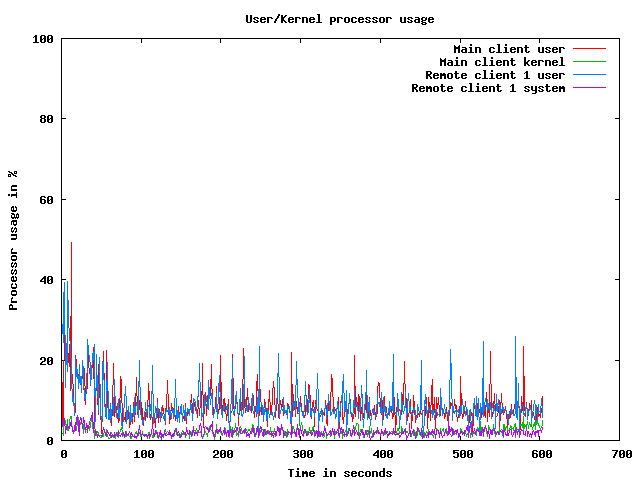
CPU usage graphs
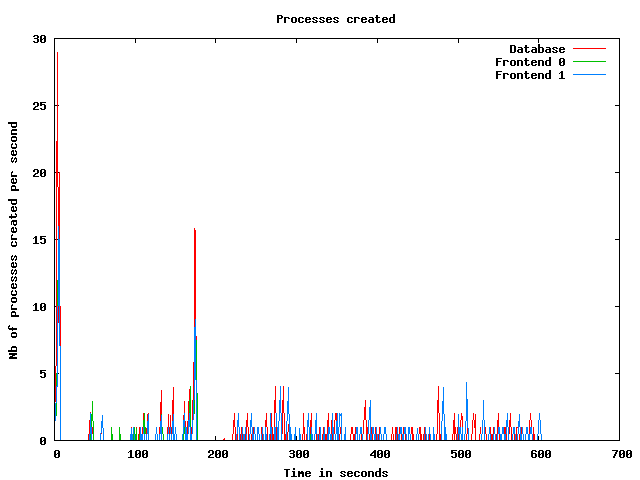
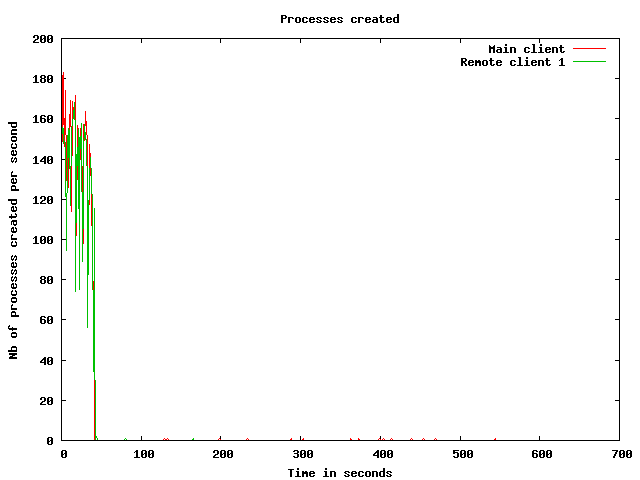
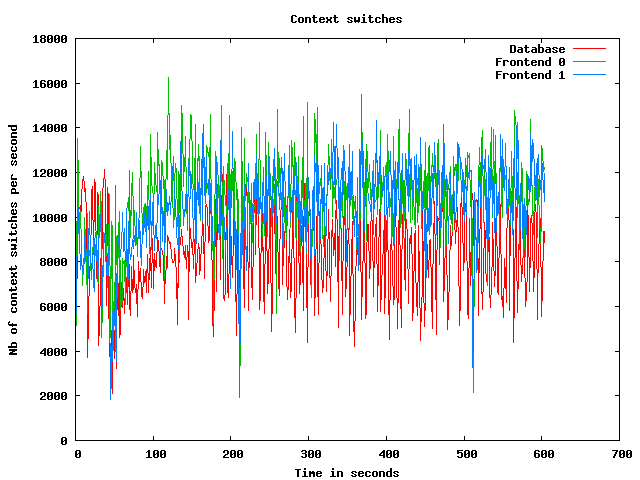
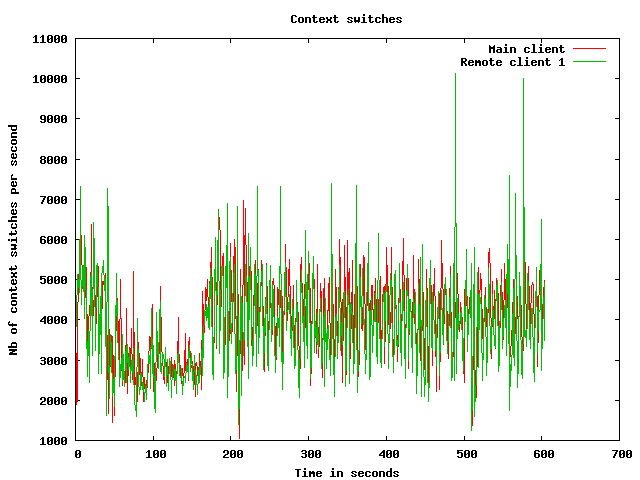
Processes usage graphs
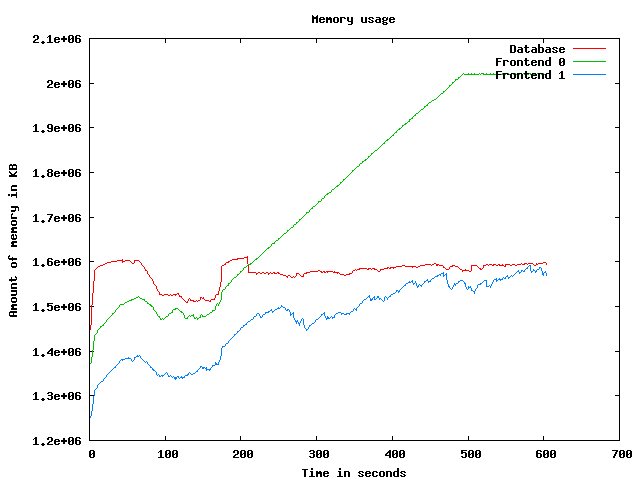
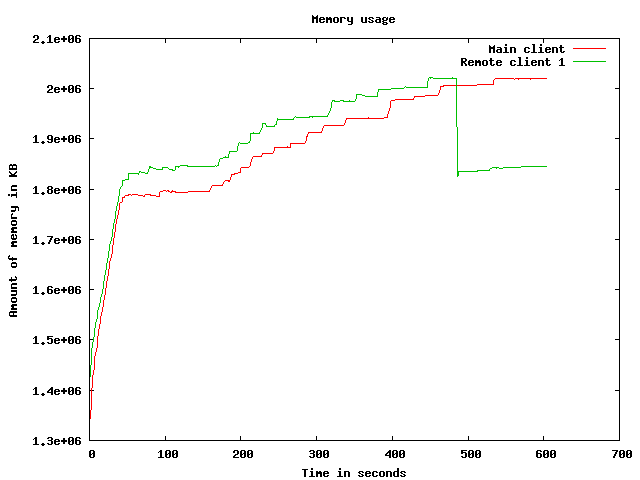
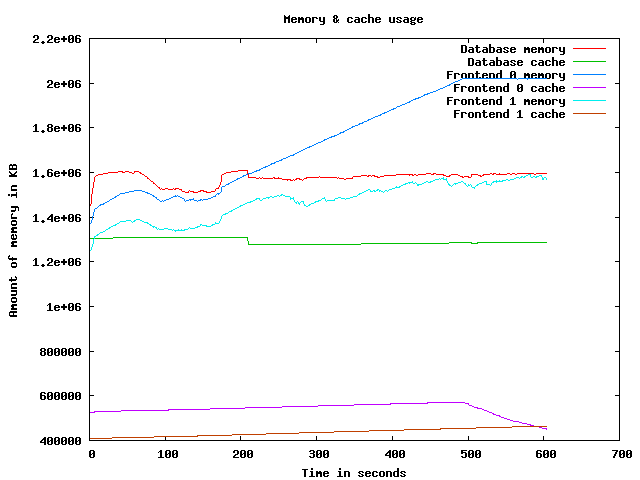
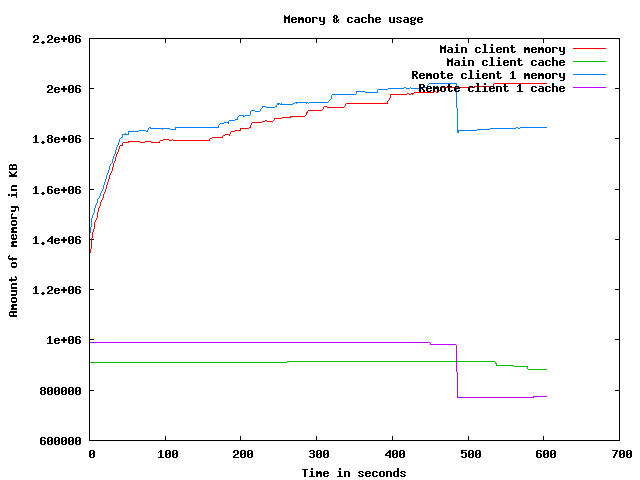
Memory usage graph
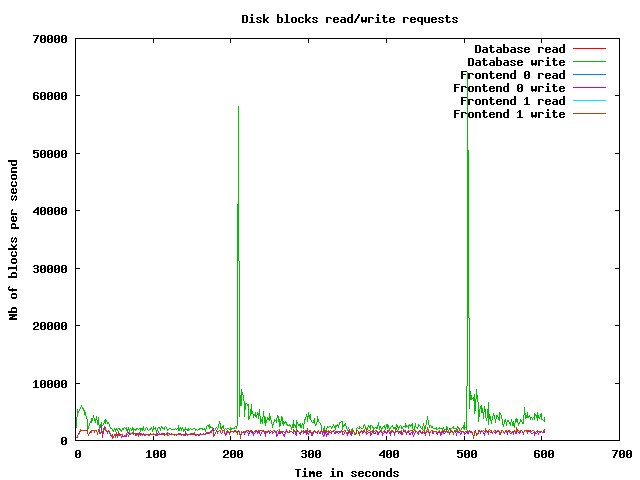
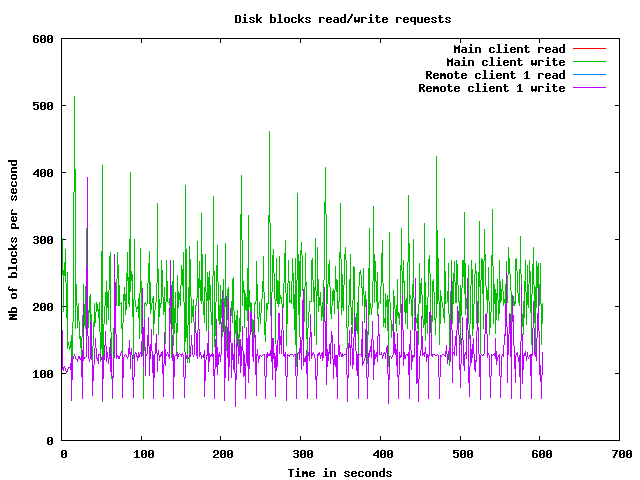
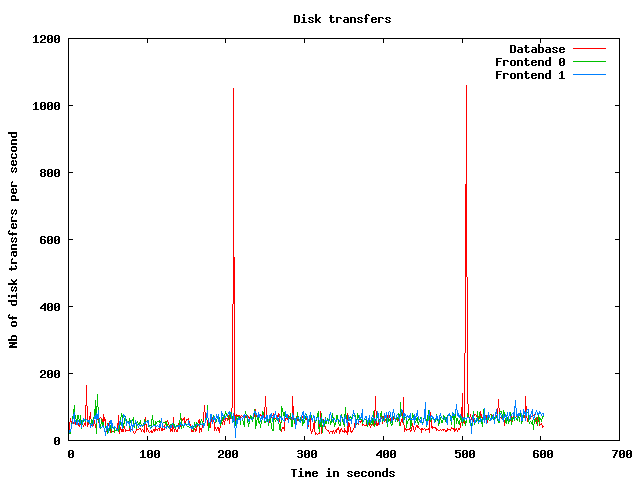
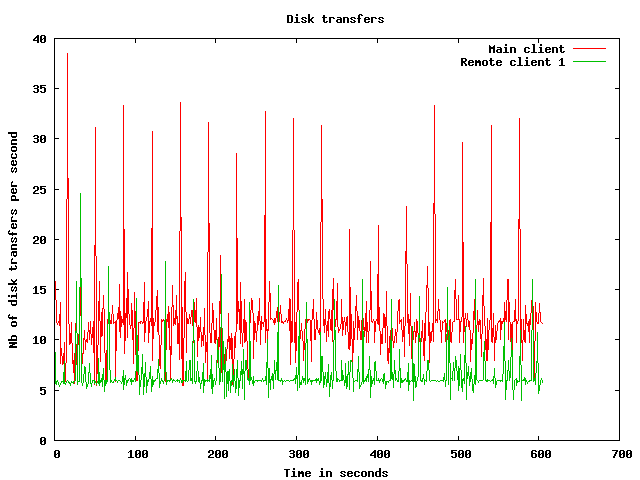
Disk usage graphs
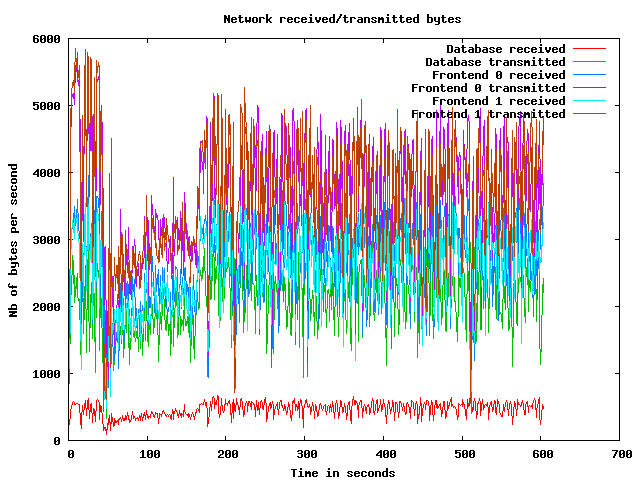
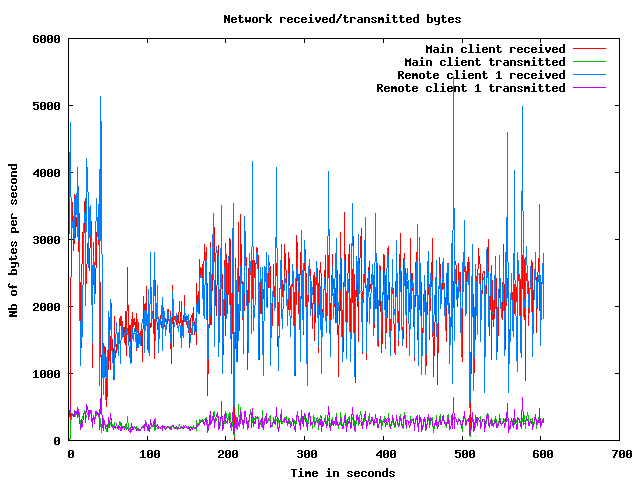
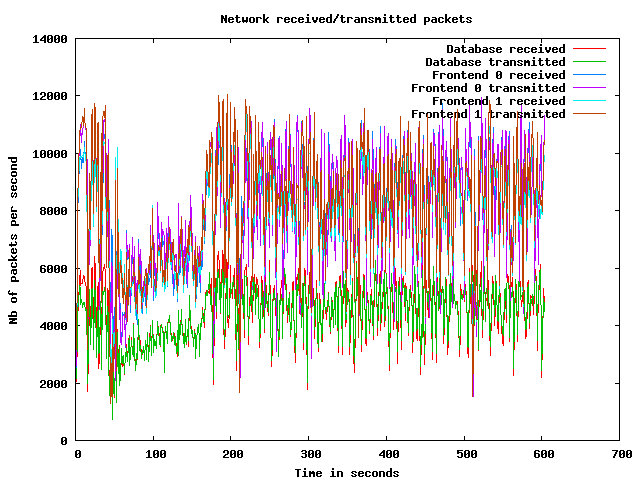
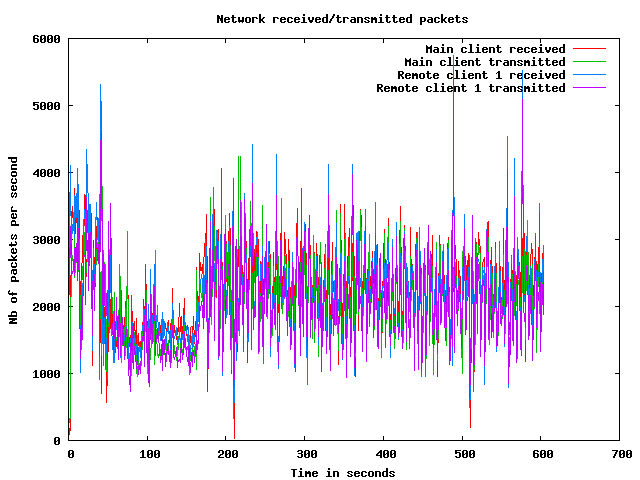
Network usage graphs
| Test start | 2009-3-20 1:52:14 |
| Up ramp start | 2009-3-20 1:52:56 |
| Runtime session start | 2009-3-20 1:54:56 |
| Down ramp start | 2009-3-20 2:2:26 |
| Test end | 2009-3-20 2:5:35 |
| Up ramp length | 2 minutes 1 millisecond (requested 120000 ms) |
| Runtime session length | 7 minutes 30 seconds 0 millisecond (requested 450000 ms) |
| Down ramp length | 30 seconds 0 millisecond (requested 30000 ms) |
| Total test length | 13 minutes 21 seconds 55 milliseconds |
| State name | % of total | Count | Errors | Minimum Time | Maximum Time | Average Time |
|---|---|---|---|---|---|---|
Home | 9 % | 8943 | 0 | 0 ms | 115443 ms | 9364 ms
|
Register | 1 % | 1291 | 0 | 0 ms | 93332 ms | 3227 ms
|
RegisterUser | 1 % | 1205 | 43 | 5 ms | 93104 ms | 2939 ms
|
Browse | 9 % | 9015 | 0 | 0 ms | 93279 ms | 3468 ms
|
BrowseCategories | 6 % | 6010 | 0 | 3 ms | 93333 ms | 2435 ms
|
SearchItemsInCategory | 14 % | 13777 | 0 | 3 ms | 93331 ms | 2117 ms
|
BrowseRegions | 2 % | 2429 | 0 | 3 ms | 93318 ms | 1989 ms
|
BrowseCategoriesInRegion | 2 % | 2267 | 0 | 3 ms | 93202 ms | 2435 ms
|
SearchItemsInRegion | 4 % | 4538 | 0 | 0 ms | 93100 ms | 2006 ms
|
ViewItem | 12 % | 11542 | 0 | 3 ms | 93352 ms | 1746 ms
|
ViewUserInfo | 2 % | 2194 | 0 | 3 ms | 93053 ms | 1865 ms
|
ViewBidHistory | 1 % | 1101 | 0 | 3 ms | 93601 ms | 2102 ms
|
BuyNowAuth | 1 % | 1054 | 0 | 2 ms | 93000 ms | 1527 ms
|
BuyNow | 1 % | 970 | 144 | 4 ms | 93051 ms | 1389 ms
|
StoreBuyBow | 0 % | 712 | 0 | 5 ms | 93021 ms | 1708 ms
|
PutBidAuth | 4 % | 3831 | 0 | 0 ms | 93320 ms | 1843 ms
|
PutBid | 4 % | 3794 | 400 | 4 ms | 93104 ms | 1572 ms
|
StoreBid | 2 % | 2222 | 0 | 5 ms | 93346 ms | 1767 ms
|
PutCommentAuth | 0 % | 0 | 0 | 0 ms | 0 ms | 0 ms
|
PutComment | 0 % | 360 | 24 | 4 ms | 93048 ms | 1793 ms
|
StoreComment | 0 % | 290 | 0 | 4 ms | 93019 ms | 893 ms
|
Sell | 0 % | 685 | 0 | 0 ms | 93282 ms | 3258 ms
|
SelectCategoryToSellItem | 0 % | 631 | 0 | 4 ms | 93296 ms | 1882 ms
|
SellItemForm | 0 % | 577 | 0 | 2 ms | 93199 ms | 2453 ms
|
RegisterItem | 0 % | 538 | 0 | 4 ms | 93313 ms | 2389 ms
|
AboutMe (auth form) | 2 % | 1939 | 0 | 0 ms | 93325 ms | 3566 ms
|
AboutMe | 2 % | 2728 | 0 | 4 ms | 93354 ms | 2385 ms
|
Back probability | 7 % | 7373 | 0 | 0 ms | 0 ms | 0 ms
|
End of Session | 1 % | 998 | 0 | 0 ms | 0 ms | 0 ms
|
Total | 100 % | 93014 | 611 | - | - | 2714 ms
|
Average throughput | 780 req/s
| |||||
Completed sessions | 912
| |||||
Total time | 56234 seconds
| |||||
Average session time | 61 seconds
| |||||
| State name | % of total | Count | Errors | Minimum Time | Maximum Time | Average Time |
|---|---|---|---|---|---|---|
Home | 4 % | 11309 | 0 | 0 ms | 238941 ms | 1298 ms
|
Register | 1 % | 2905 | 0 | 0 ms | 283794 ms | 3645 ms
|
RegisterUser | 1 % | 2877 | 151 | 5 ms | 385012 ms | 4255 ms
|
Browse | 6 % | 19193 | 0 | 0 ms | 380690 ms | 3567 ms
|
BrowseCategories | 4 % | 13486 | 0 | 3 ms | 380013 ms | 3681 ms
|
SearchItemsInCategory | 15 % | 42654 | 0 | 3 ms | 389523 ms | 3629 ms
|
BrowseRegions | 1 % | 5480 | 0 | 3 ms | 380019 ms | 3277 ms
|
BrowseCategoriesInRegion | 1 % | 5370 | 0 | 3 ms | 212257 ms | 2970 ms
|
SearchItemsInRegion | 5 % | 14147 | 0 | 0 ms | 385900 ms | 3641 ms
|
ViewItem | 14 % | 38984 | 0 | 3 ms | 389836 ms | 3344 ms
|
ViewUserInfo | 3 % | 9062 | 0 | 3 ms | 283570 ms | 3340 ms
|
ViewBidHistory | 1 % | 4736 | 0 | 4 ms | 259876 ms | 4103 ms
|
BuyNowAuth | 1 % | 3667 | 0 | 2 ms | 311450 ms | 3395 ms
|
BuyNow | 1 % | 3563 | 467 | 4 ms | 327888 ms | 3573 ms
|
StoreBuyBow | 1 % | 3058 | 3 | 5 ms | 296867 ms | 3317 ms
|
PutBidAuth | 4 % | 13708 | 0 | 0 ms | 380004 ms | 3312 ms
|
PutBid | 5 % | 15866 | 1586 | 0 ms | 380779 ms | 3590 ms
|
StoreBid | 3 % | 10567 | 11 | 5 ms | 385892 ms | 3351 ms
|
PutCommentAuth | 0 % | 0 | 0 | 0 ms | 0 ms | 0 ms
|
PutComment | 0 % | 1368 | 95 | 4 ms | 302462 ms | 4207 ms
|
StoreComment | 0 % | 1262 | 0 | 5 ms | 283834 ms | 3468 ms
|
Sell | 0 % | 1577 | 0 | 0 ms | 211890 ms | 2909 ms
|
SelectCategoryToSellItem | 0 % | 1549 | 0 | 4 ms | 390681 ms | 3301 ms
|
SellItemForm | 0 % | 1532 | 0 | 2 ms | 213489 ms | 3410 ms
|
RegisterItem | 0 % | 1509 | 0 | 5 ms | 212890 ms | 3150 ms
|
AboutMe (auth form) | 1 % | 4557 | 0 | 0 ms | 401517 ms | 3575 ms
|
AboutMe | 2 % | 7752 | 0 | 5 ms | 285522 ms | 3389 ms
|
Back probability | 10 % | 29077 | 0 | 0 ms | 0 ms | 0 ms
|
End of Session | 1 % | 4094 | 0 | 0 ms | 0 ms | 0 ms
|
Total | 100 % | 274909 | 2313 | - | - | 2963 ms
|
Average throughput | 616 req/s
| |||||
Completed sessions | 4115
| |||||
Total time | 1158449 seconds
| |||||
Average session time | 281 seconds
| |||||
| State name | % of total | Count | Errors | Minimum Time | Maximum Time | Average Time |
|---|---|---|---|---|---|---|
Home | 4 % | 492 | 0 | 0 ms | 211083 ms | 3536 ms
|
Register | 1 % | 141 | 0 | 0 ms | 388997 ms | 8780 ms
|
RegisterUser | 1 % | 119 | 9 | 5 ms | 283263 ms | 11219 ms
|
Browse | 6 % | 766 | 0 | 0 ms | 389002 ms | 8790 ms
|
BrowseCategories | 4 % | 538 | 0 | 3 ms | 193480 ms | 7875 ms
|
SearchItemsInCategory | 15 % | 1795 | 0 | 3 ms | 389009 ms | 8025 ms
|
BrowseRegions | 1 % | 212 | 0 | 3 ms | 339097 ms | 10119 ms
|
BrowseCategoriesInRegion | 1 % | 222 | 0 | 3 ms | 283256 ms | 7155 ms
|
SearchItemsInRegion | 5 % | 587 | 0 | 0 ms | 389048 ms | 7118 ms
|
ViewItem | 14 % | 1587 | 0 | 3 ms | 389036 ms | 8518 ms
|
ViewUserInfo | 2 % | 315 | 0 | 3 ms | 193032 ms | 9666 ms
|
ViewBidHistory | 1 % | 178 | 0 | 3 ms | 190032 ms | 6345 ms
|
BuyNowAuth | 1 % | 126 | 0 | 2 ms | 211003 ms | 11952 ms
|
BuyNow | 1 % | 141 | 25 | 6 ms | 190108 ms | 12240 ms
|
StoreBuyBow | 1 % | 126 | 0 | 5 ms | 190008 ms | 8844 ms
|
PutBidAuth | 5 % | 566 | 0 | 0 ms | 389005 ms | 7543 ms
|
PutBid | 5 % | 632 | 68 | 5 ms | 199230 ms | 8521 ms
|
StoreBid | 3 % | 408 | 0 | 5 ms | 283243 ms | 8949 ms
|
PutCommentAuth | 0 % | 0 | 0 | 0 ms | 0 ms | 0 ms
|
PutComment | 0 % | 68 | 4 | 5 ms | 93031 ms | 2355 ms
|
StoreComment | 0 % | 48 | 0 | 6 ms | 190010 ms | 8211 ms
|
Sell | 0 % | 66 | 0 | 0 ms | 389002 ms | 17926 ms
|
SelectCategoryToSellItem | 0 % | 63 | 0 | 4 ms | 190019 ms | 7437 ms
|
SellItemForm | 0 % | 74 | 0 | 2 ms | 190004 ms | 9900 ms
|
RegisterItem | 0 % | 59 | 0 | 5 ms | 190013 ms | 6083 ms
|
AboutMe (auth form) | 1 % | 208 | 0 | 0 ms | 389010 ms | 10848 ms
|
AboutMe | 3 % | 339 | 0 | 6 ms | 283328 ms | 7572 ms
|
Back probability | 10 % | 1179 | 0 | 0 ms | 0 ms | 0 ms
|
End of Session | 1 % | 181 | 0 | 0 ms | 0 ms | 0 ms
|
Total | 100 % | 11236 | 106 | - | - | 7147 ms
|
Average throughput | 378 req/s
| |||||
Completed sessions | 168
| |||||
Total time | 73617 seconds
| |||||
Average session time | 438 seconds
| |||||
| State name | % of total | Count | Errors | Minimum Time | Maximum Time | Average Time |
|---|---|---|---|---|---|---|
Home | 5 % | 20763 | 0 | 0 ms | 382989 ms | 5023 ms
|
Register | 1 % | 4349 | 0 | 0 ms | 388997 ms | 4250 ms
|
RegisterUser | 1 % | 4221 | 203 | 5 ms | 385012 ms | 4471 ms
|
Browse | 7 % | 29103 | 0 | 0 ms | 389002 ms | 4202 ms
|
BrowseCategories | 5 % | 20124 | 0 | 3 ms | 380016 ms | 3819 ms
|
SearchItemsInCategory | 15 % | 58735 | 0 | 3 ms | 389523 ms | 3894 ms
|
BrowseRegions | 2 % | 8159 | 0 | 3 ms | 380044 ms | 3509 ms
|
BrowseCategoriesInRegion | 2 % | 7890 | 0 | 3 ms | 473022 ms | 3433 ms
|
SearchItemsInRegion | 5 % | 19418 | 0 | 0 ms | 389048 ms | 3971 ms
|
ViewItem | 13 % | 52446 | 0 | 3 ms | 389836 ms | 3651 ms
|
ViewUserInfo | 3 % | 11653 | 0 | 3 ms | 395430 ms | 3879 ms
|
ViewBidHistory | 1 % | 6058 | 0 | 3 ms | 473041 ms | 4431 ms
|
BuyNowAuth | 1 % | 4864 | 0 | 2 ms | 380019 ms | 3853 ms
|
BuyNow | 1 % | 4698 | 639 | 4 ms | 380018 ms | 3828 ms
|
StoreBuyBow | 1 % | 3915 | 3 | 5 ms | 296867 ms | 3877 ms
|
PutBidAuth | 4 % | 18181 | 0 | 0 ms | 395431 ms | 3555 ms
|
PutBid | 5 % | 20433 | 2066 | 0 ms | 383019 ms | 4012 ms
|
StoreBid | 3 % | 13274 | 11 | 5 ms | 385892 ms | 3892 ms
|
PutCommentAuth | 0 % | 0 | 0 | 0 ms | 0 ms | 0 ms
|
PutComment | 0 % | 1807 | 123 | 4 ms | 302462 ms | 4384 ms
|
StoreComment | 0 % | 1611 | 0 | 4 ms | 283834 ms | 3553 ms
|
Sell | 0 % | 2336 | 0 | 0 ms | 389002 ms | 3763 ms
|
SelectCategoryToSellItem | 0 % | 2252 | 0 | 4 ms | 390681 ms | 3348 ms
|
SellItemForm | 0 % | 2187 | 0 | 2 ms | 213489 ms | 3743 ms
|
RegisterItem | 0 % | 2116 | 0 | 4 ms | 380020 ms | 3531 ms
|
AboutMe (auth form) | 1 % | 6727 | 0 | 0 ms | 401517 ms | 4276 ms
|
AboutMe | 2 % | 10928 | 0 | 4 ms | 380020 ms | 3689 ms
|
Back probability | 9 % | 37815 | 0 | 0 ms | 0 ms | 0 ms
|
End of Session | 1 % | 5292 | 0 | 0 ms | 0 ms | 0 ms
|
Total | 100 % | 381355 | 3045 | - | - | 3462 ms
|
Average throughput | 640 req/s
| |||||
Completed sessions | 5292
| |||||
Total time | 1335449 seconds
| |||||
Average session time | 252 seconds
| |||||
An error occured while waiting for remote processes termination (Skipping waits)
Command is: /usr/bin/scp farm6.csail.mit.edu:/tmp/client1 /home/drkp/sandbox/txcache/src/RUBiS-1.4.3/bench/2009-3-20@1:52:14//client1.bin
Command is: /usr/bin/ssh -x localhost /bin/bash -c 'LANG=en_GB.UTF-8 /usr/bin/sar -n DEV -n SOCK -rubcw 1 605 -f /home/drkp/sandbox/txcache/src/RUBiS-1.4.3/bench/2009-3-20@1:52:14//client1.bin > /home/drkp/sandbox/txcache/src/RUBiS-1.4.3/bench/2009-3-20@1:52:14//client1'
Command is: /usr/bin/scp farm14:/tmp/db_server0 /home/drkp/sandbox/txcache/src/RUBiS-1.4.3/bench/2009-3-20@1:52:14//db_server0.bin
Command is: /usr/bin/ssh -x localhost /bin/bash -c 'LANG=en_GB.UTF-8 /usr/bin/sar -n DEV -n SOCK -rubcw 1 605 -f /home/drkp/sandbox/txcache/src/RUBiS-1.4.3/bench/2009-3-20@1:52:14//db_server0.bin > /home/drkp/sandbox/txcache/src/RUBiS-1.4.3/bench/2009-3-20@1:52:14//db_server0'
Command is: /usr/bin/scp farm12.csail.mit.edu:/tmp/web_server0 /home/drkp/sandbox/txcache/src/RUBiS-1.4.3/bench/2009-3-20@1:52:14//web_server0.bin
Command is: /usr/bin/ssh -x localhost /bin/bash -c 'LANG=en_GB.UTF-8 /usr/bin/sar -n DEV -n SOCK -rubcw 1 605 -f /home/drkp/sandbox/txcache/src/RUBiS-1.4.3/bench/2009-3-20@1:52:14//web_server0.bin > /home/drkp/sandbox/txcache/src/RUBiS-1.4.3/bench/2009-3-20@1:52:14//web_server0'
Command is: /usr/bin/scp farm13.csail.mit.edu:/tmp/web_server1 /home/drkp/sandbox/txcache/src/RUBiS-1.4.3/bench/2009-3-20@1:52:14//web_server1.bin
Command is: /usr/bin/ssh -x localhost /bin/bash -c 'LANG=en_GB.UTF-8 /usr/bin/sar -n DEV -n SOCK -rubcw 1 605 -f /home/drkp/sandbox/txcache/src/RUBiS-1.4.3/bench/2009-3-20@1:52:14//web_server1.bin > /home/drkp/sandbox/txcache/src/RUBiS-1.4.3/bench/2009-3-20@1:52:14//web_server1'
Command is: /usr/bin/scp localhost:/tmp/client0 /home/drkp/sandbox/txcache/src/RUBiS-1.4.3/bench/2009-3-20@1:52:14//client0.bin
Command is: /usr/bin/ssh -x localhost /bin/bash -c 'LANG=en_GB.UTF-8 /usr/bin/sar -n DEV -n SOCK -rubcw 1 605 -f /home/drkp/sandbox/txcache/src/RUBiS-1.4.3/bench/2009-3-20@1:52:14//client0.bin > /home/drkp/sandbox/txcache/src/RUBiS-1.4.3/bench/2009-3-20@1:52:14//client0'
Command is: /usr/bin/scp farm6.csail.mit.edu:/tmp/trace_client1.html /home/drkp/sandbox/txcache/src/RUBiS-1.4.3/bench/2009-3-20@1:52:14//
Command is: /usr/bin/scp farm6.csail.mit.edu:/tmp/stat_client1.html /home/drkp/sandbox/txcache/src/RUBiS-1.4.3/bench/2009-3-20@1:52:14//
|
|
|
|
|
|
 | 
|
 | 
|
 | 
|
 | 
|
 | 
|
 | 
|
 | 
|
 | 
|
 | 
|