Node information
Test timing information
Up ramp statistics
Runtime session statistics
Down ramp statistics
Overall statistics
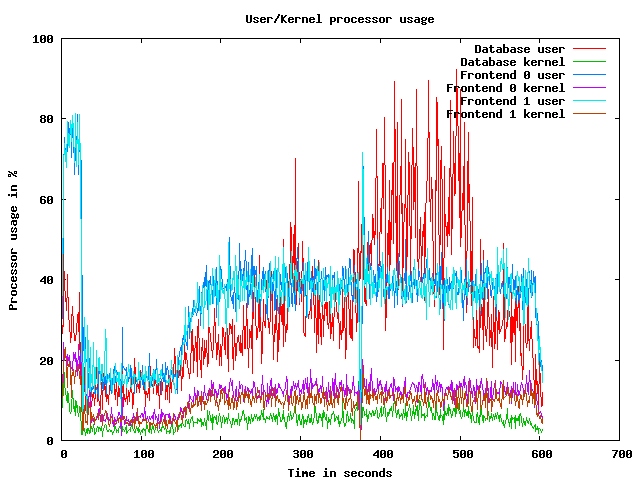
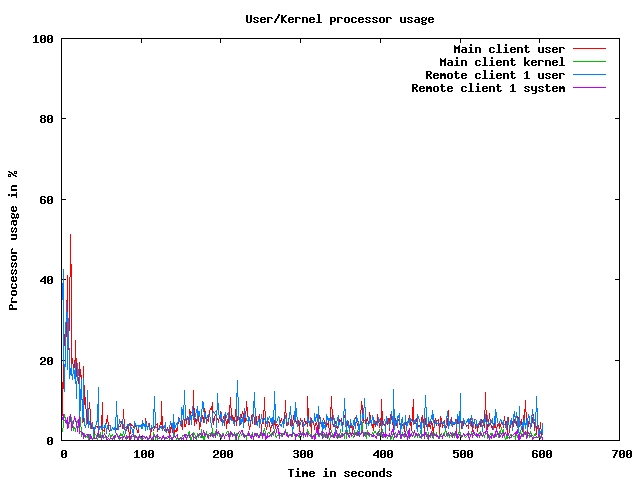
CPU usage graphs
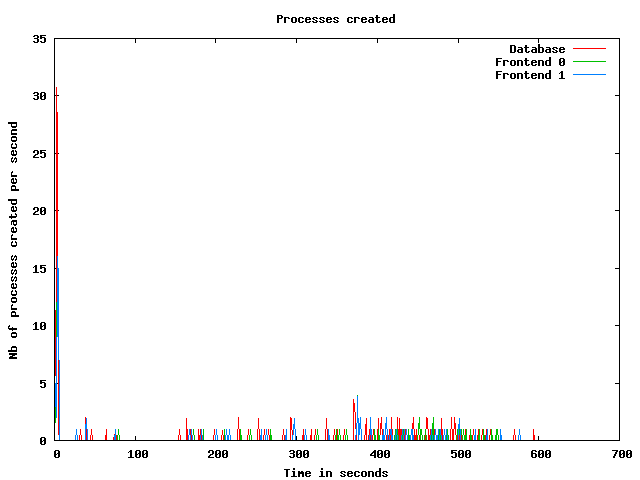
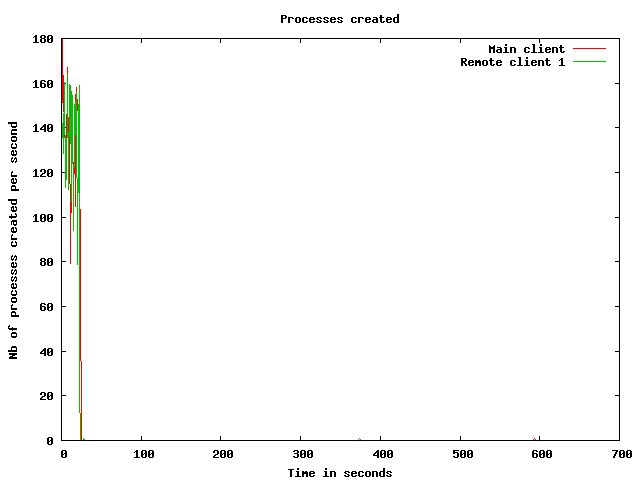
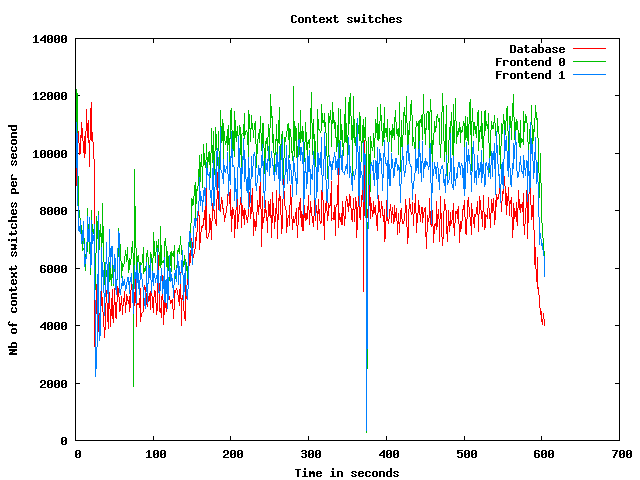
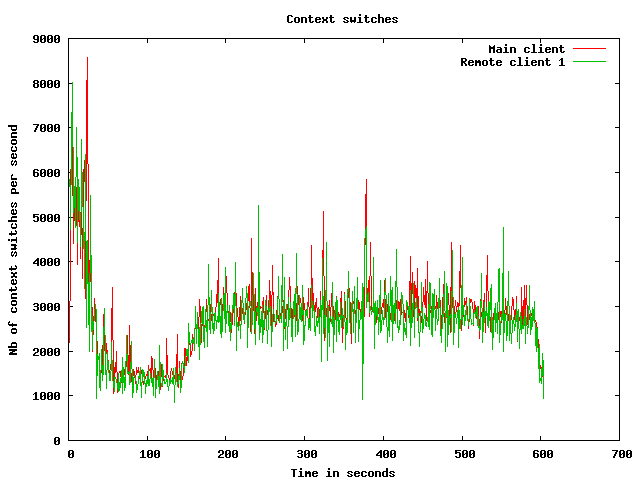
Processes usage graphs
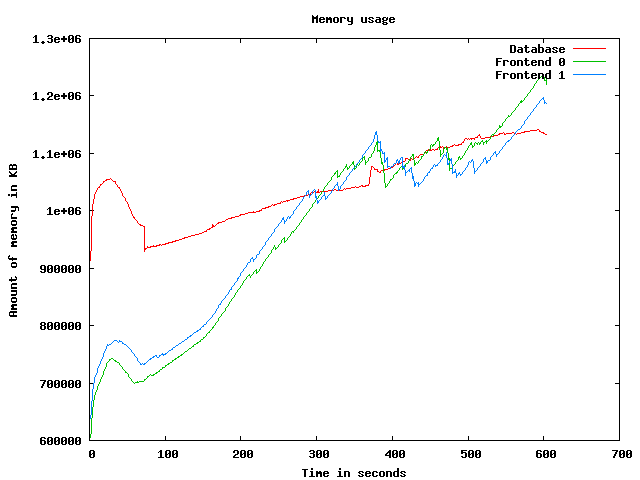
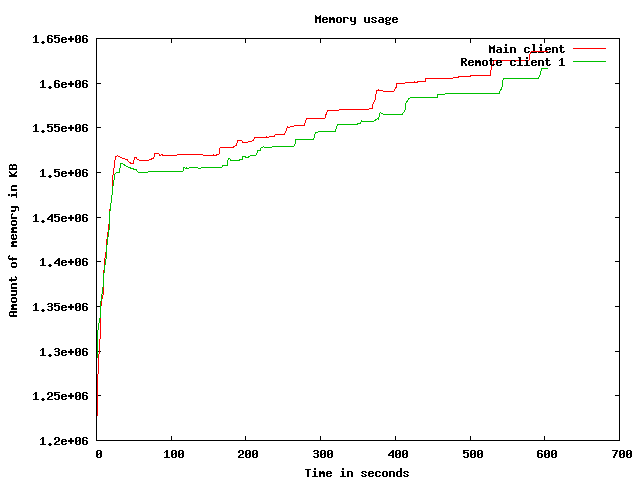
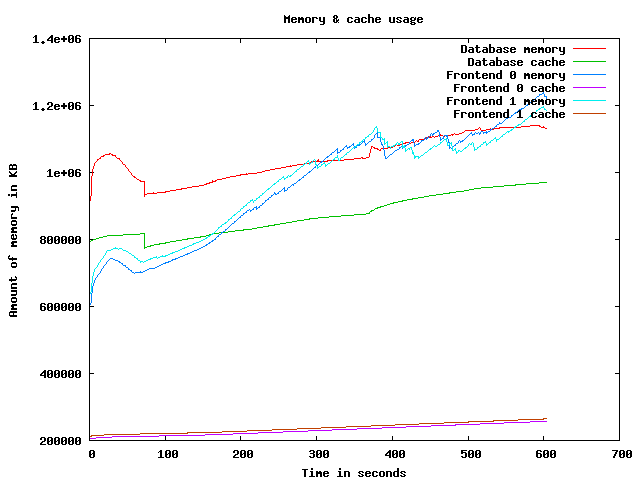
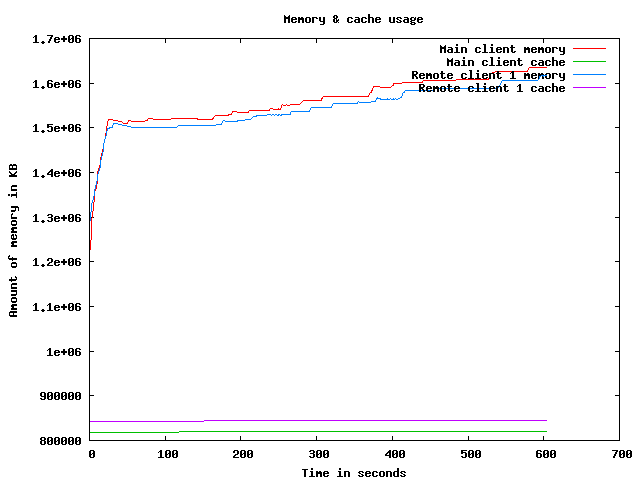
Memory usage graph
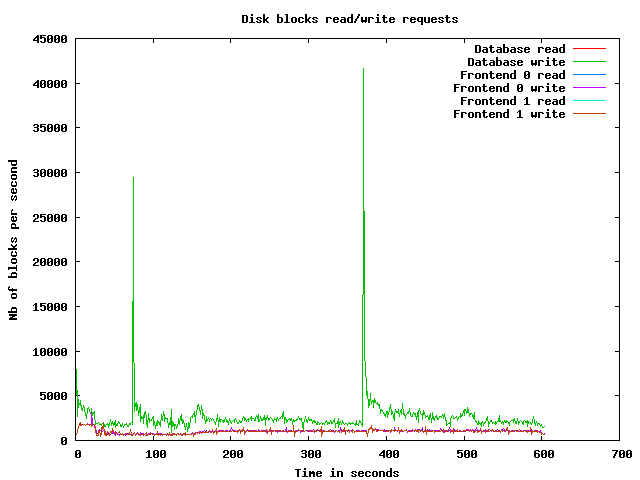
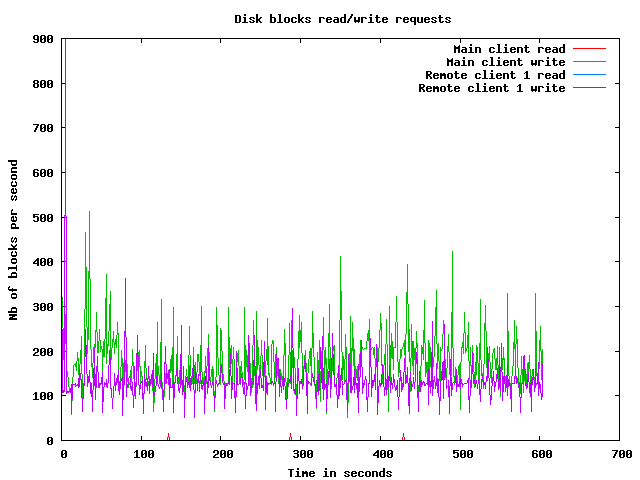
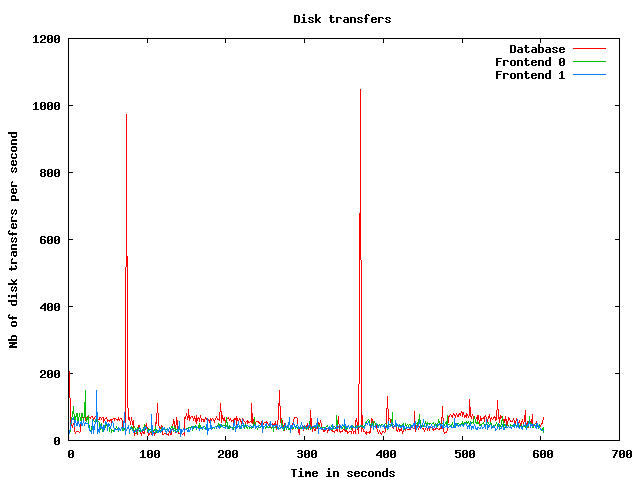
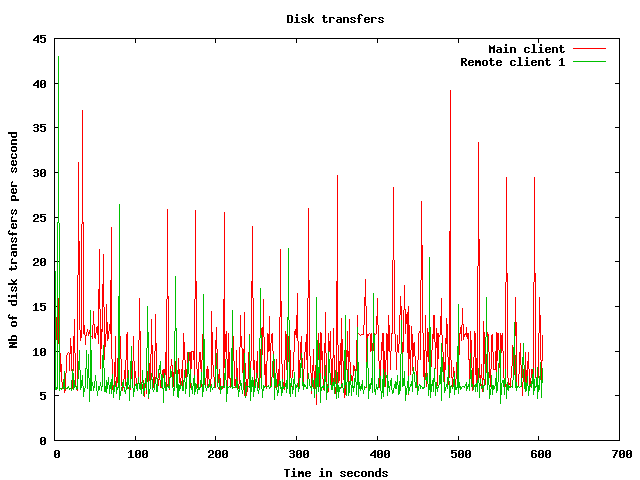
Disk usage graphs
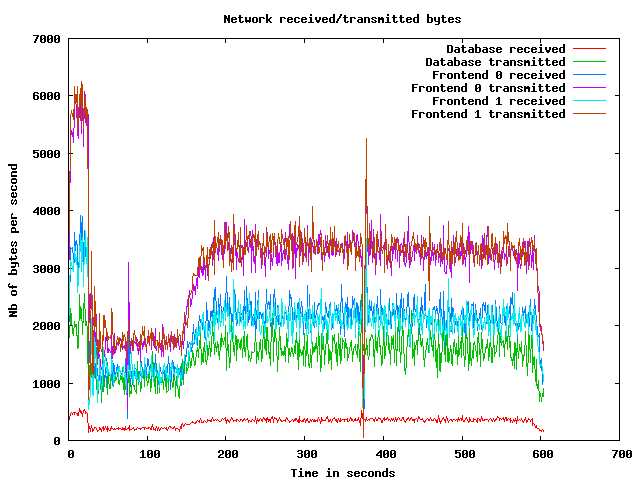
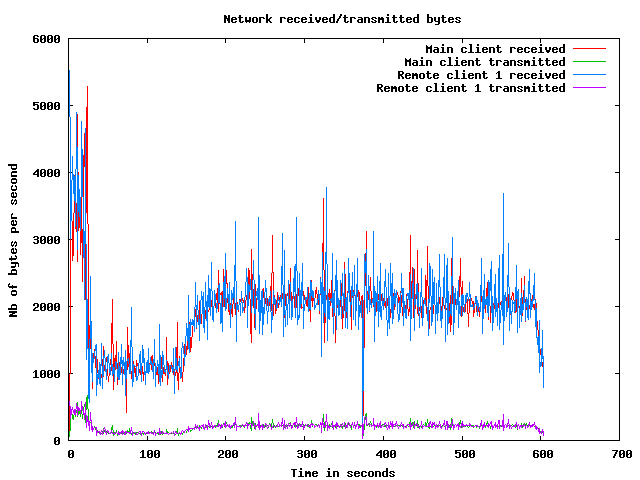
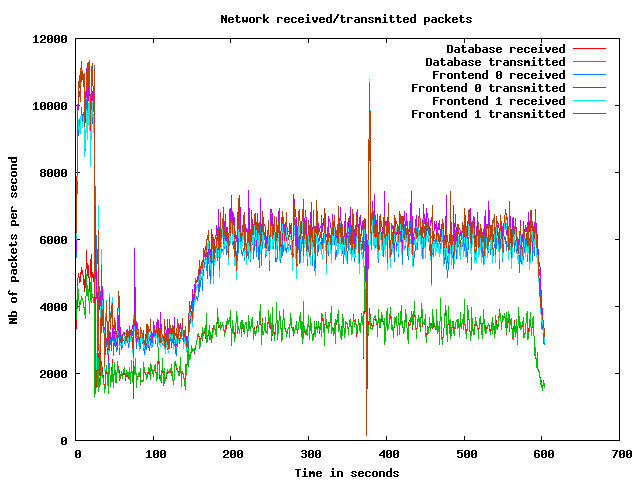
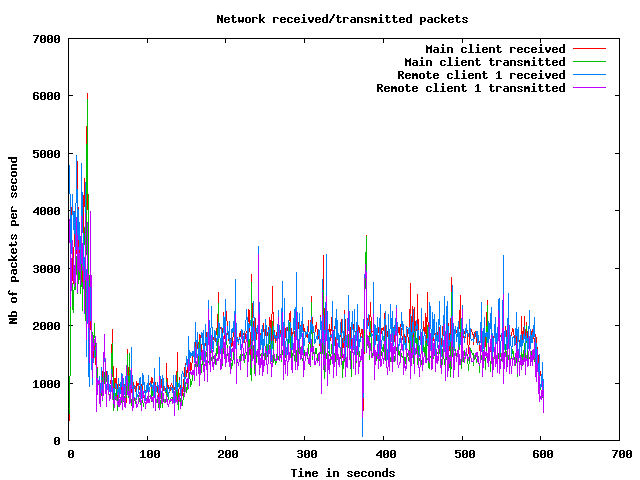
Network usage graphs
| Test start | 2009-3-20 0:44:30 |
| Up ramp start | 2009-3-20 0:44:56 |
| Runtime session start | 2009-3-20 0:46:56 |
| Down ramp start | 2009-3-20 0:54:26 |
| Test end | 2009-3-20 0:56:58 |
| Up ramp length | 2 minutes 0 millisecond (requested 120000 ms) |
| Runtime session length | 7 minutes 30 seconds 1 millisecond (requested 450000 ms) |
| Down ramp length | 30 seconds 0 millisecond (requested 30000 ms) |
| Total test length | 12 minutes 27 seconds 903 milliseconds |
| State name | % of total | Count | Errors | Minimum Time | Maximum Time | Average Time |
|---|---|---|---|---|---|---|
Home | 9 % | 5981 | 0 | 0 ms | 45088 ms | 3434 ms
|
Register | 1 % | 835 | 0 | 0 ms | 45038 ms | 1691 ms
|
RegisterUser | 1 % | 773 | 2 | 5 ms | 45027 ms | 1116 ms
|
Browse | 9 % | 5948 | 0 | 0 ms | 45080 ms | 1439 ms
|
BrowseCategories | 6 % | 3982 | 0 | 3 ms | 45052 ms | 1106 ms
|
SearchItemsInCategory | 14 % | 9150 | 0 | 0 ms | 45105 ms | 982 ms
|
BrowseRegions | 2 % | 1598 | 0 | 3 ms | 45027 ms | 1222 ms
|
BrowseCategoriesInRegion | 2 % | 1486 | 0 | 3 ms | 45012 ms | 1161 ms
|
SearchItemsInRegion | 4 % | 3019 | 0 | 0 ms | 45042 ms | 839 ms
|
ViewItem | 12 % | 7986 | 0 | 3 ms | 45050 ms | 922 ms
|
ViewUserInfo | 2 % | 1478 | 0 | 3 ms | 45016 ms | 735 ms
|
ViewBidHistory | 1 % | 748 | 0 | 3 ms | 45043 ms | 811 ms
|
BuyNowAuth | 1 % | 654 | 0 | 2 ms | 45011 ms | 644 ms
|
BuyNow | 0 % | 610 | 97 | 4 ms | 45017 ms | 824 ms
|
StoreBuyBow | 0 % | 452 | 0 | 4 ms | 45037 ms | 925 ms
|
PutBidAuth | 4 % | 2699 | 0 | 0 ms | 45024 ms | 754 ms
|
PutBid | 4 % | 2679 | 403 | 3 ms | 45047 ms | 780 ms
|
StoreBid | 2 % | 1540 | 1 | 4 ms | 45014 ms | 767 ms
|
PutCommentAuth | 0 % | 0 | 0 | 0 ms | 0 ms | 0 ms
|
PutComment | 0 % | 222 | 22 | 4 ms | 21150 ms | 545 ms
|
StoreComment | 0 % | 178 | 0 | 4 ms | 45014 ms | 731 ms
|
Sell | 0 % | 432 | 0 | 0 ms | 44999 ms | 1365 ms
|
SelectCategoryToSellItem | 0 % | 404 | 0 | 4 ms | 45015 ms | 1140 ms
|
SellItemForm | 0 % | 373 | 0 | 2 ms | 45017 ms | 1538 ms
|
RegisterItem | 0 % | 350 | 0 | 4 ms | 45023 ms | 1794 ms
|
AboutMe (auth form) | 2 % | 1388 | 0 | 0 ms | 45042 ms | 1248 ms
|
AboutMe | 3 % | 1993 | 0 | 4 ms | 45138 ms | 1194 ms
|
Back probability | 7 % | 4950 | 0 | 0 ms | 0 ms | 0 ms
|
End of Session | 1 % | 659 | 0 | 0 ms | 0 ms | 0 ms
|
Total | 100 % | 62567 | 525 | - | - | 1162 ms
|
Average throughput | 525 req/s
| |||||
Completed sessions | 606
| |||||
Total time | 32043 seconds
| |||||
Average session time | 52 seconds
| |||||
| State name | % of total | Count | Errors | Minimum Time | Maximum Time | Average Time |
|---|---|---|---|---|---|---|
Home | 4 % | 11839 | 0 | 0 ms | 9033 ms | 5 ms
|
Register | 1 % | 2802 | 0 | 0 ms | 3557 ms | 8 ms
|
RegisterUser | 1 % | 2742 | 19 | 5 ms | 3719 ms | 24 ms
|
Browse | 7 % | 18542 | 0 | 0 ms | 9058 ms | 14 ms
|
BrowseCategories | 4 % | 12894 | 0 | 3 ms | 9042 ms | 25 ms
|
SearchItemsInCategory | 15 % | 40517 | 0 | 0 ms | 9061 ms | 23 ms
|
BrowseRegions | 2 % | 5424 | 0 | 3 ms | 9066 ms | 22 ms
|
BrowseCategoriesInRegion | 2 % | 5338 | 0 | 3 ms | 3674 ms | 22 ms
|
SearchItemsInRegion | 5 % | 12986 | 0 | 0 ms | 9080 ms | 44 ms
|
ViewItem | 14 % | 36570 | 0 | 3 ms | 9164 ms | 29 ms
|
ViewUserInfo | 3 % | 8393 | 0 | 3 ms | 9035 ms | 22 ms
|
ViewBidHistory | 1 % | 4399 | 0 | 3 ms | 9047 ms | 42 ms
|
BuyNowAuth | 1 % | 3310 | 0 | 2 ms | 3942 ms | 15 ms
|
BuyNow | 1 % | 3229 | 496 | 3 ms | 3509 ms | 23 ms
|
StoreBuyBow | 1 % | 2705 | 1 | 4 ms | 3694 ms | 28 ms
|
PutBidAuth | 4 % | 12790 | 0 | 0 ms | 9059 ms | 21 ms
|
PutBid | 5 % | 14683 | 1722 | 1 ms | 9100 ms | 28 ms
|
StoreBid | 3 % | 9568 | 3 | 4 ms | 9060 ms | 27 ms
|
PutCommentAuth | 0 % | 0 | 0 | 0 ms | 0 ms | 0 ms
|
PutComment | 0 % | 1229 | 91 | 4 ms | 3571 ms | 25 ms
|
StoreComment | 0 % | 1114 | 0 | 4 ms | 9031 ms | 30 ms
|
Sell | 0 % | 1496 | 0 | 0 ms | 3430 ms | 18 ms
|
SelectCategoryToSellItem | 0 % | 1472 | 0 | 3 ms | 9035 ms | 28 ms
|
SellItemForm | 0 % | 1453 | 0 | 2 ms | 9070 ms | 25 ms
|
RegisterItem | 0 % | 1423 | 0 | 4 ms | 3452 ms | 21 ms
|
AboutMe (auth form) | 1 % | 4258 | 0 | 0 ms | 3663 ms | 15 ms
|
AboutMe | 2 % | 7188 | 0 | 4 ms | 9203 ms | 55 ms
|
Back probability | 10 % | 26814 | 0 | 0 ms | 0 ms | 0 ms
|
End of Session | 1 % | 3827 | 0 | 0 ms | 0 ms | 0 ms
|
Total | 100 % | 259005 | 2332 | - | - | 22 ms
|
Average throughput | 580 req/s
| |||||
Completed sessions | 3830
| |||||
Total time | 959507 seconds
| |||||
Average session time | 250 seconds
| |||||
| State name | % of total | Count | Errors | Minimum Time | Maximum Time | Average Time |
|---|---|---|---|---|---|---|
Home | 4 % | 372 | 0 | 0 ms | 39 ms | 0 ms
|
Register | 0 % | 83 | 0 | 0 ms | 11 ms | 0 ms
|
RegisterUser | 1 % | 87 | 1 | 5 ms | 34 ms | 11 ms
|
Browse | 6 % | 592 | 0 | 0 ms | 131 ms | 1 ms
|
BrowseCategories | 4 % | 403 | 0 | 3 ms | 49 ms | 6 ms
|
SearchItemsInCategory | 15 % | 1308 | 0 | 0 ms | 133 ms | 7 ms
|
BrowseRegions | 1 % | 160 | 0 | 3 ms | 34 ms | 7 ms
|
BrowseCategoriesInRegion | 2 % | 184 | 0 | 3 ms | 21 ms | 5 ms
|
SearchItemsInRegion | 4 % | 420 | 0 | 0 ms | 331 ms | 17 ms
|
ViewItem | 14 % | 1199 | 0 | 3 ms | 155 ms | 11 ms
|
ViewUserInfo | 3 % | 308 | 0 | 3 ms | 33 ms | 8 ms
|
ViewBidHistory | 1 % | 168 | 0 | 4 ms | 158 ms | 25 ms
|
BuyNowAuth | 1 % | 122 | 0 | 2 ms | 32 ms | 4 ms
|
BuyNow | 1 % | 130 | 17 | 5 ms | 31 ms | 9 ms
|
StoreBuyBow | 1 % | 98 | 0 | 4 ms | 72 ms | 11 ms
|
PutBidAuth | 4 % | 396 | 0 | 0 ms | 131 ms | 4 ms
|
PutBid | 5 % | 476 | 70 | 4 ms | 152 ms | 12 ms
|
StoreBid | 3 % | 294 | 0 | 5 ms | 47 ms | 10 ms
|
PutCommentAuth | 0 % | 0 | 0 | 0 ms | 0 ms | 0 ms
|
PutComment | 0 % | 45 | 2 | 3 ms | 39 ms | 9 ms
|
StoreComment | 0 % | 41 | 0 | 4 ms | 35 ms | 8 ms
|
Sell | 0 % | 36 | 0 | 0 ms | 3 ms | 0 ms
|
SelectCategoryToSellItem | 0 % | 44 | 0 | 4 ms | 58 ms | 8 ms
|
SellItemForm | 0 % | 38 | 0 | 2 ms | 135 ms | 7 ms
|
RegisterItem | 0 % | 39 | 0 | 5 ms | 42 ms | 9 ms
|
AboutMe (auth form) | 1 % | 151 | 0 | 0 ms | 14 ms | 0 ms
|
AboutMe | 2 % | 238 | 0 | 4 ms | 97 ms | 28 ms
|
Back probability | 10 % | 913 | 0 | 0 ms | 0 ms | 0 ms
|
End of Session | 1 % | 116 | 0 | 0 ms | 0 ms | 0 ms
|
Total | 100 % | 8461 | 90 | - | - | 7 ms
|
Average throughput | 285 req/s
| |||||
Completed sessions | 110
| |||||
Total time | 38815 seconds
| |||||
Average session time | 352 seconds
| |||||
| State name | % of total | Count | Errors | Minimum Time | Maximum Time | Average Time |
|---|---|---|---|---|---|---|
Home | 5 % | 18192 | 0 | 0 ms | 45088 ms | 1132 ms
|
Register | 1 % | 3720 | 0 | 0 ms | 45038 ms | 385 ms
|
RegisterUser | 1 % | 3602 | 22 | 5 ms | 45027 ms | 258 ms
|
Browse | 7 % | 25082 | 0 | 0 ms | 45080 ms | 351 ms
|
BrowseCategories | 5 % | 17279 | 0 | 3 ms | 45052 ms | 274 ms
|
SearchItemsInCategory | 15 % | 51157 | 0 | 0 ms | 45105 ms | 194 ms
|
BrowseRegions | 2 % | 7182 | 0 | 3 ms | 45027 ms | 289 ms
|
BrowseCategoriesInRegion | 2 % | 7008 | 0 | 3 ms | 45012 ms | 263 ms
|
SearchItemsInRegion | 4 % | 16467 | 0 | 0 ms | 45042 ms | 189 ms
|
ViewItem | 13 % | 45856 | 0 | 3 ms | 45050 ms | 184 ms
|
ViewUserInfo | 3 % | 10198 | 0 | 3 ms | 45016 ms | 125 ms
|
ViewBidHistory | 1 % | 5332 | 0 | 3 ms | 45043 ms | 150 ms
|
BuyNowAuth | 1 % | 4086 | 0 | 2 ms | 45011 ms | 115 ms
|
BuyNow | 1 % | 3969 | 610 | 3 ms | 45017 ms | 146 ms
|
StoreBuyBow | 0 % | 3255 | 1 | 4 ms | 45037 ms | 152 ms
|
PutBidAuth | 4 % | 15885 | 0 | 0 ms | 45024 ms | 145 ms
|
PutBid | 5 % | 17886 | 2195 | 1 ms | 45047 ms | 140 ms
|
StoreBid | 3 % | 11402 | 4 | 4 ms | 45014 ms | 126 ms
|
PutCommentAuth | 0 % | 0 | 0 | 0 ms | 0 ms | 0 ms
|
PutComment | 0 % | 1496 | 115 | 3 ms | 21150 ms | 102 ms
|
StoreComment | 0 % | 1333 | 0 | 4 ms | 45014 ms | 123 ms
|
Sell | 0 % | 1964 | 0 | 0 ms | 44999 ms | 314 ms
|
SelectCategoryToSellItem | 0 % | 1920 | 0 | 3 ms | 45015 ms | 262 ms
|
SellItemForm | 0 % | 1864 | 0 | 2 ms | 45017 ms | 328 ms
|
RegisterItem | 0 % | 1812 | 0 | 4 ms | 45023 ms | 363 ms
|
AboutMe (auth form) | 1 % | 5797 | 0 | 0 ms | 45042 ms | 310 ms
|
AboutMe | 2 % | 9457 | 0 | 4 ms | 45138 ms | 294 ms
|
Back probability | 9 % | 32677 | 0 | 0 ms | 0 ms | 0 ms
|
End of Session | 1 % | 4602 | 0 | 0 ms | 0 ms | 0 ms
|
Total | 100 % | 330480 | 2947 | - | - | 237 ms
|
Average throughput | 555 req/s
| |||||
Completed sessions | 4602
| |||||
Total time | 1053161 seconds
| |||||
Average session time | 228 seconds
| |||||
An error occured while waiting for remote processes termination (Skipping waits)
Command is: /usr/bin/scp farm6.csail.mit.edu:/tmp/client1 /home/drkp/sandbox/txcache/src/RUBiS-1.4.3/bench/2009-3-20@0:44:30//client1.bin
Command is: /usr/bin/ssh -x localhost /bin/bash -c 'LANG=en_GB.UTF-8 /usr/bin/sar -n DEV -n SOCK -rubcw 1 605 -f /home/drkp/sandbox/txcache/src/RUBiS-1.4.3/bench/2009-3-20@0:44:30//client1.bin > /home/drkp/sandbox/txcache/src/RUBiS-1.4.3/bench/2009-3-20@0:44:30//client1'
Command is: /usr/bin/scp farm14:/tmp/db_server0 /home/drkp/sandbox/txcache/src/RUBiS-1.4.3/bench/2009-3-20@0:44:30//db_server0.bin
Command is: /usr/bin/ssh -x localhost /bin/bash -c 'LANG=en_GB.UTF-8 /usr/bin/sar -n DEV -n SOCK -rubcw 1 605 -f /home/drkp/sandbox/txcache/src/RUBiS-1.4.3/bench/2009-3-20@0:44:30//db_server0.bin > /home/drkp/sandbox/txcache/src/RUBiS-1.4.3/bench/2009-3-20@0:44:30//db_server0'
Command is: /usr/bin/scp farm12.csail.mit.edu:/tmp/web_server0 /home/drkp/sandbox/txcache/src/RUBiS-1.4.3/bench/2009-3-20@0:44:30//web_server0.bin
Command is: /usr/bin/ssh -x localhost /bin/bash -c 'LANG=en_GB.UTF-8 /usr/bin/sar -n DEV -n SOCK -rubcw 1 605 -f /home/drkp/sandbox/txcache/src/RUBiS-1.4.3/bench/2009-3-20@0:44:30//web_server0.bin > /home/drkp/sandbox/txcache/src/RUBiS-1.4.3/bench/2009-3-20@0:44:30//web_server0'
Command is: /usr/bin/scp farm13.csail.mit.edu:/tmp/web_server1 /home/drkp/sandbox/txcache/src/RUBiS-1.4.3/bench/2009-3-20@0:44:30//web_server1.bin
Command is: /usr/bin/ssh -x localhost /bin/bash -c 'LANG=en_GB.UTF-8 /usr/bin/sar -n DEV -n SOCK -rubcw 1 605 -f /home/drkp/sandbox/txcache/src/RUBiS-1.4.3/bench/2009-3-20@0:44:30//web_server1.bin > /home/drkp/sandbox/txcache/src/RUBiS-1.4.3/bench/2009-3-20@0:44:30//web_server1'
Command is: /usr/bin/scp localhost:/tmp/client0 /home/drkp/sandbox/txcache/src/RUBiS-1.4.3/bench/2009-3-20@0:44:30//client0.bin
Command is: /usr/bin/ssh -x localhost /bin/bash -c 'LANG=en_GB.UTF-8 /usr/bin/sar -n DEV -n SOCK -rubcw 1 605 -f /home/drkp/sandbox/txcache/src/RUBiS-1.4.3/bench/2009-3-20@0:44:30//client0.bin > /home/drkp/sandbox/txcache/src/RUBiS-1.4.3/bench/2009-3-20@0:44:30//client0'
Command is: /usr/bin/scp farm6.csail.mit.edu:/tmp/trace_client1.html /home/drkp/sandbox/txcache/src/RUBiS-1.4.3/bench/2009-3-20@0:44:30//
Command is: /usr/bin/scp farm6.csail.mit.edu:/tmp/stat_client1.html /home/drkp/sandbox/txcache/src/RUBiS-1.4.3/bench/2009-3-20@0:44:30//
|
|
|
|
|
|
 | 
|
 | 
|
 | 
|
 | 
|
 | 
|
 | 
|
 | 
|
 | 
|
 | 
|