Node information
Test timing information
Up ramp statistics
Runtime session statistics
Down ramp statistics
Overall statistics
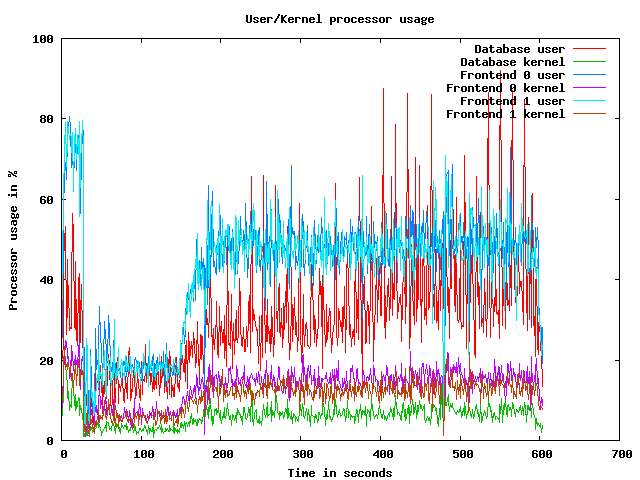
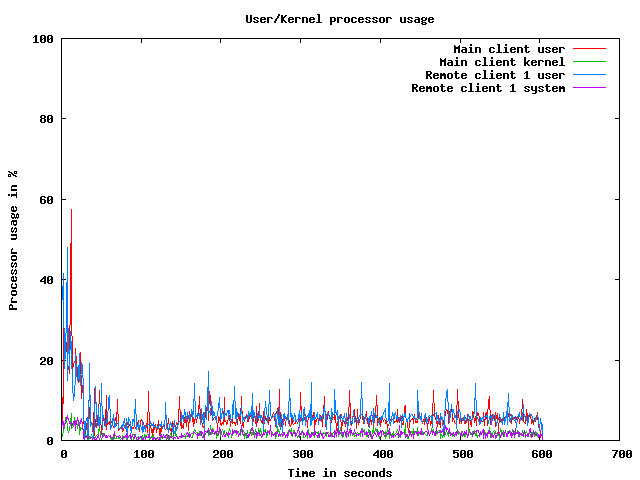
CPU usage graphs
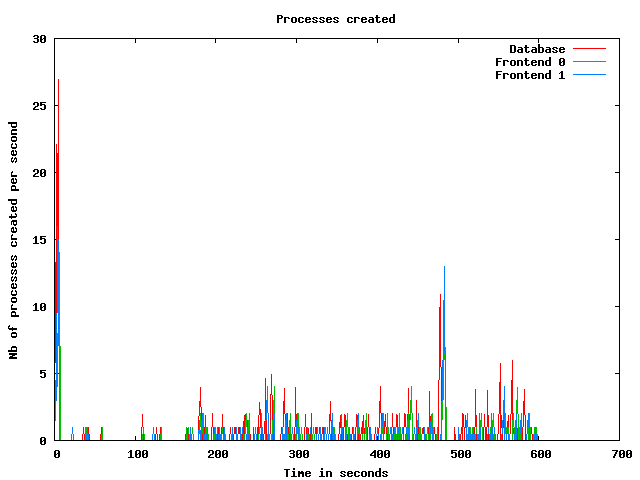
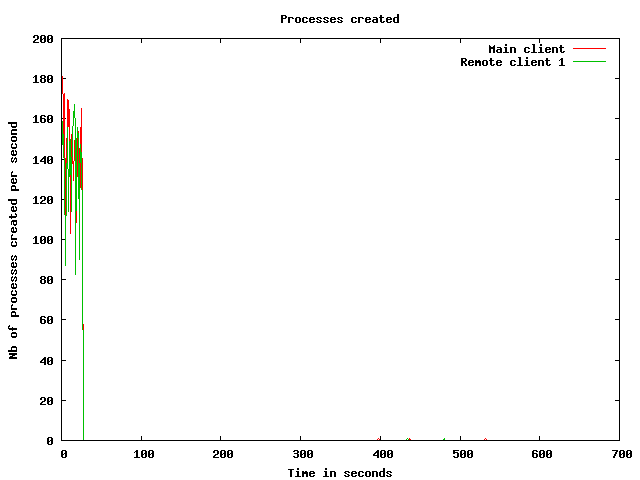
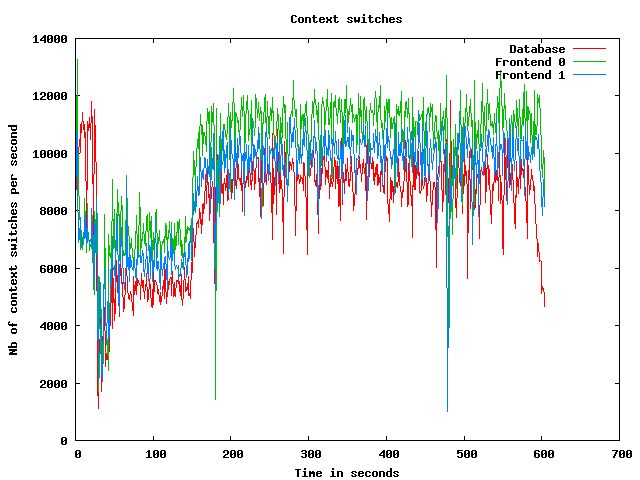
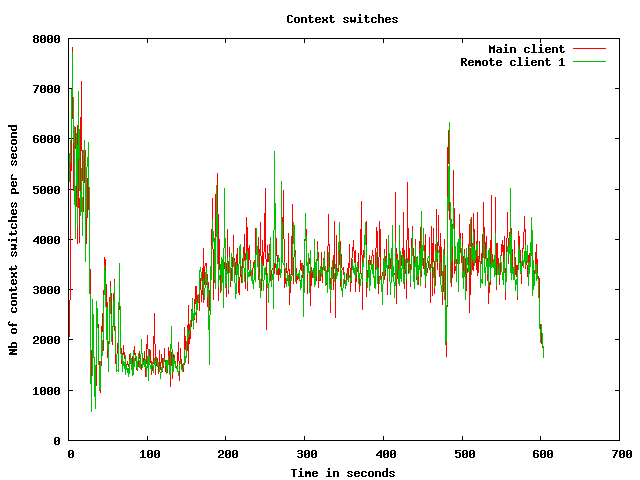
Processes usage graphs
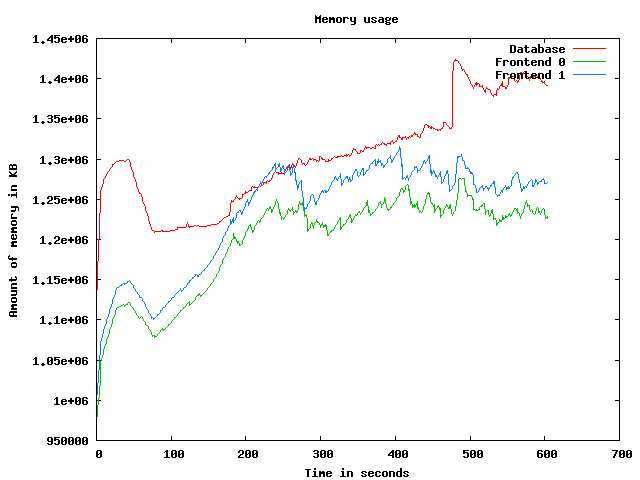
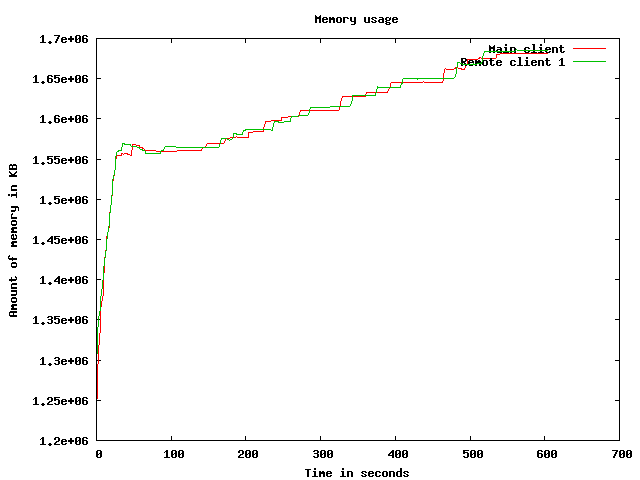
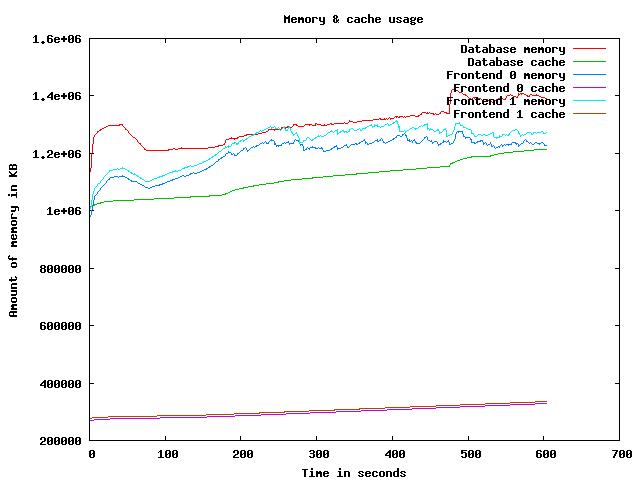
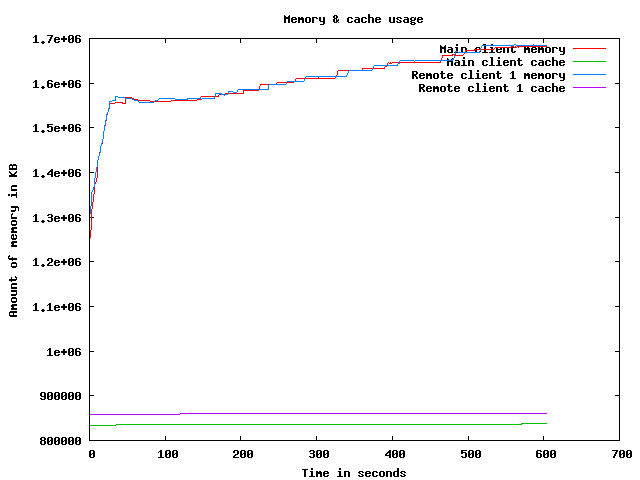
Memory usage graph
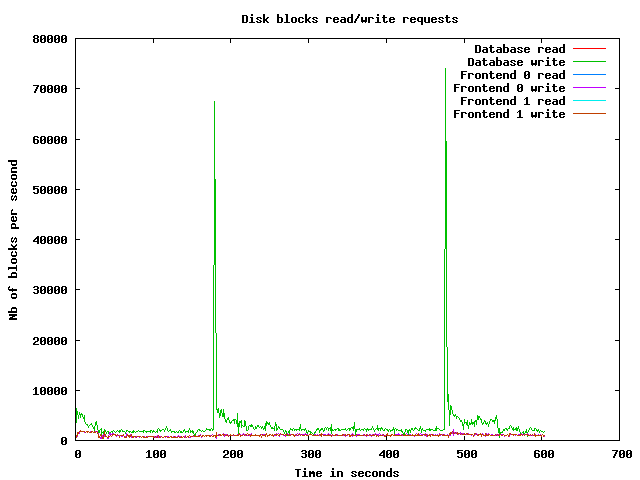
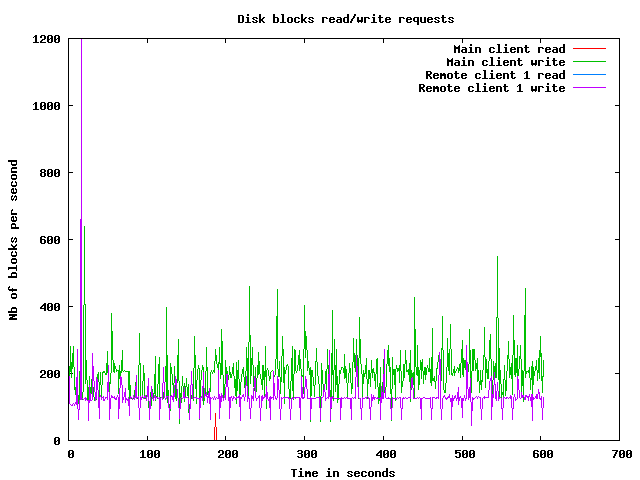
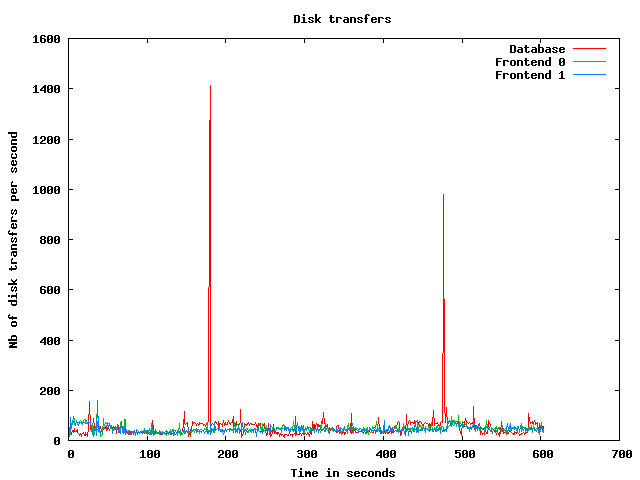
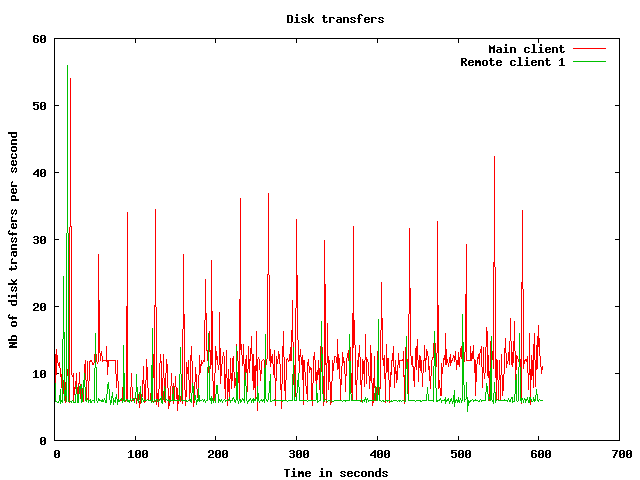
Disk usage graphs
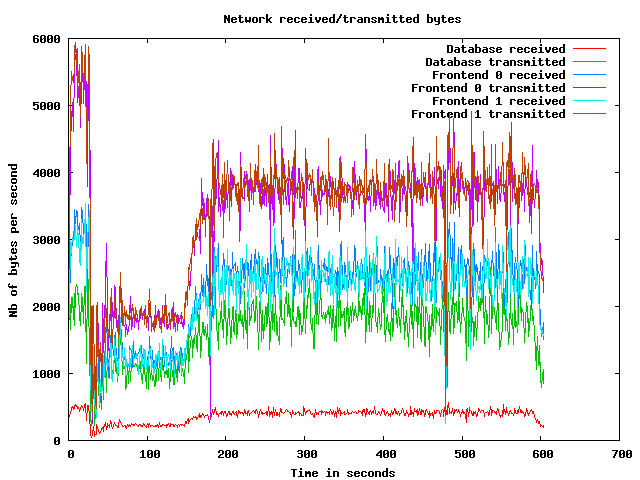
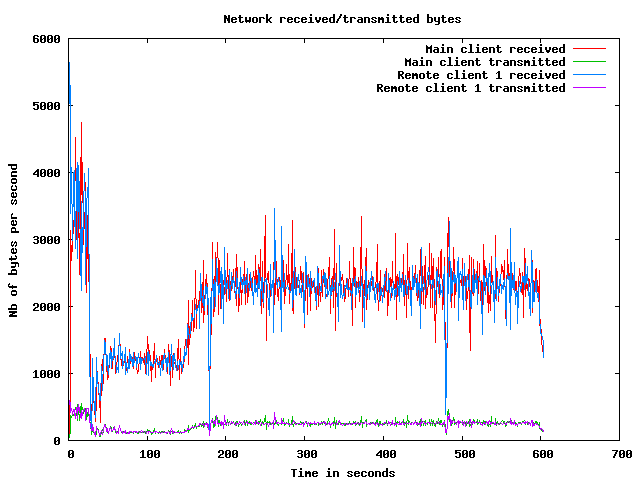
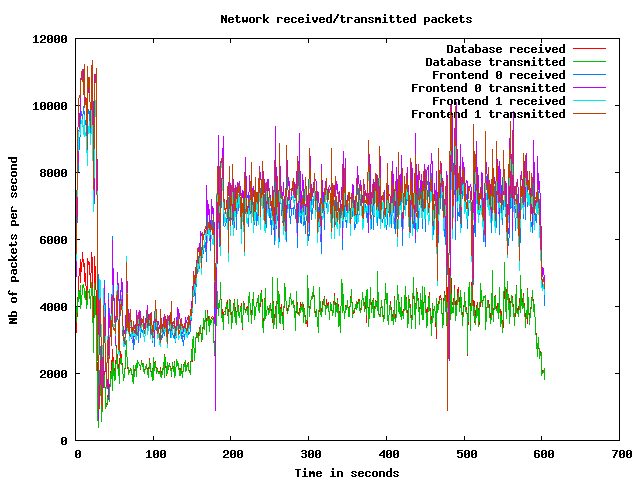
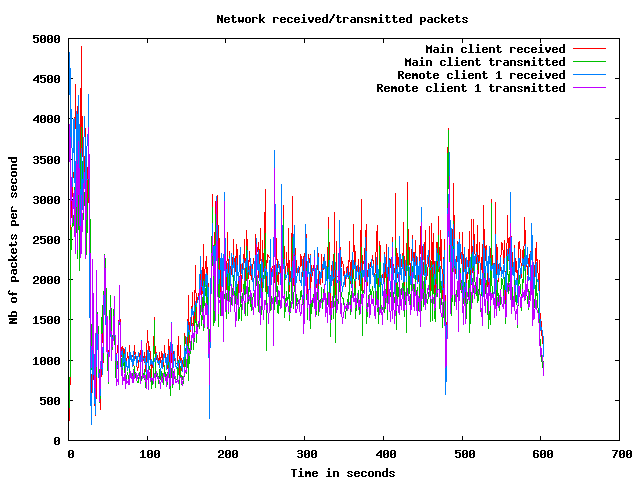
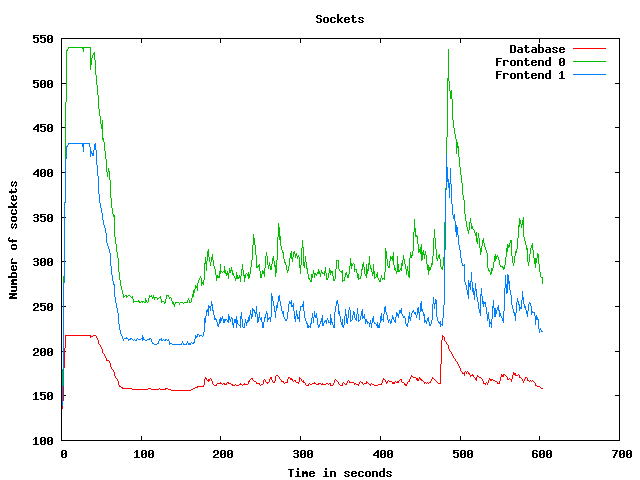
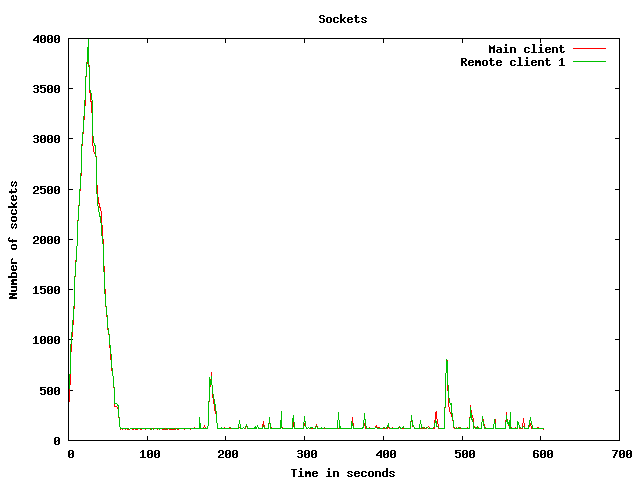
Network usage graphs
| Test start | 2009-3-20 0:57:44 |
| Up ramp start | 2009-3-20 0:58:13 |
| Runtime session start | 2009-3-20 1:0:13 |
| Down ramp start | 2009-3-20 1:7:43 |
| Test end | 2009-3-20 1:10:16 |
| Up ramp length | 2 minutes 1 millisecond (requested 120000 ms) |
| Runtime session length | 7 minutes 30 seconds 0 millisecond (requested 450000 ms) |
| Down ramp length | 30 seconds 0 millisecond (requested 30000 ms) |
| Total test length | 12 minutes 32 seconds 307 milliseconds |
| State name | % of total | Count | Errors | Minimum Time | Maximum Time | Average Time |
|---|---|---|---|---|---|---|
Home | 9 % | 6473 | 0 | 0 ms | 59275 ms | 5509 ms
|
Register | 1 % | 898 | 0 | 0 ms | 45230 ms | 1519 ms
|
RegisterUser | 1 % | 838 | 6 | 4 ms | 45115 ms | 1367 ms
|
Browse | 9 % | 6399 | 0 | 0 ms | 45402 ms | 2270 ms
|
BrowseCategories | 6 % | 4233 | 0 | 3 ms | 59114 ms | 1798 ms
|
SearchItemsInCategory | 14 % | 9668 | 0 | 0 ms | 45395 ms | 1416 ms
|
BrowseRegions | 2 % | 1770 | 0 | 3 ms | 45108 ms | 1646 ms
|
BrowseCategoriesInRegion | 2 % | 1652 | 0 | 3 ms | 45188 ms | 1871 ms
|
SearchItemsInRegion | 5 % | 3334 | 0 | 0 ms | 45399 ms | 1289 ms
|
ViewItem | 12 % | 8349 | 0 | 3 ms | 45346 ms | 1266 ms
|
ViewUserInfo | 2 % | 1510 | 0 | 3 ms | 59114 ms | 1297 ms
|
ViewBidHistory | 1 % | 806 | 0 | 3 ms | 45131 ms | 1039 ms
|
BuyNowAuth | 1 % | 711 | 0 | 2 ms | 45043 ms | 1437 ms
|
BuyNow | 0 % | 640 | 115 | 4 ms | 45057 ms | 982 ms
|
StoreBuyBow | 0 % | 454 | 0 | 4 ms | 45026 ms | 675 ms
|
PutBidAuth | 4 % | 2827 | 0 | 0 ms | 45444 ms | 1414 ms
|
PutBid | 4 % | 2785 | 393 | 1 ms | 45451 ms | 1060 ms
|
StoreBid | 2 % | 1594 | 0 | 4 ms | 45417 ms | 1474 ms
|
PutCommentAuth | 0 % | 0 | 0 | 0 ms | 0 ms | 0 ms
|
PutComment | 0 % | 235 | 16 | 4 ms | 45048 ms | 918 ms
|
StoreComment | 0 % | 195 | 0 | 5 ms | 45013 ms | 1151 ms
|
Sell | 0 % | 432 | 0 | 0 ms | 59132 ms | 2851 ms
|
SelectCategoryToSellItem | 0 % | 392 | 0 | 3 ms | 45015 ms | 1157 ms
|
SellItemForm | 0 % | 362 | 0 | 2 ms | 45002 ms | 950 ms
|
RegisterItem | 0 % | 334 | 0 | 4 ms | 45025 ms | 3136 ms
|
AboutMe (auth form) | 2 % | 1445 | 0 | 0 ms | 59101 ms | 1724 ms
|
AboutMe | 3 % | 2011 | 0 | 4 ms | 45114 ms | 1807 ms
|
Back probability | 7 % | 5185 | 0 | 0 ms | 0 ms | 0 ms
|
End of Session | 1 % | 718 | 0 | 0 ms | 0 ms | 0 ms
|
Total | 100 % | 66250 | 530 | - | - | 1775 ms
|
Average throughput | 556 req/s
| |||||
Completed sessions | 652
| |||||
Total time | 34379 seconds
| |||||
Average session time | 52 seconds
| |||||
| State name | % of total | Count | Errors | Minimum Time | Maximum Time | Average Time |
|---|---|---|---|---|---|---|
Home | 4 % | 12960 | 0 | 0 ms | 9314 ms | 18 ms
|
Register | 1 % | 2981 | 0 | 0 ms | 9214 ms | 43 ms
|
RegisterUser | 0 % | 2908 | 40 | 5 ms | 9481 ms | 47 ms
|
Browse | 7 % | 20975 | 0 | 0 ms | 9619 ms | 34 ms
|
BrowseCategories | 4 % | 14638 | 0 | 3 ms | 9446 ms | 46 ms
|
SearchItemsInCategory | 15 % | 46148 | 0 | 0 ms | 9646 ms | 56 ms
|
BrowseRegions | 2 % | 6078 | 0 | 3 ms | 9587 ms | 52 ms
|
BrowseCategoriesInRegion | 2 % | 5974 | 0 | 3 ms | 9622 ms | 47 ms
|
SearchItemsInRegion | 5 % | 14794 | 0 | 0 ms | 9665 ms | 67 ms
|
ViewItem | 14 % | 41803 | 0 | 3 ms | 9717 ms | 58 ms
|
ViewUserInfo | 3 % | 9582 | 0 | 3 ms | 9354 ms | 60 ms
|
ViewBidHistory | 1 % | 5034 | 0 | 3 ms | 9420 ms | 93 ms
|
BuyNowAuth | 1 % | 3862 | 0 | 2 ms | 9277 ms | 38 ms
|
BuyNow | 1 % | 3802 | 580 | 4 ms | 9318 ms | 53 ms
|
StoreBuyBow | 1 % | 3197 | 1 | 4 ms | 9040 ms | 55 ms
|
PutBidAuth | 4 % | 14670 | 0 | 0 ms | 9630 ms | 47 ms
|
PutBid | 5 % | 16829 | 1959 | 3 ms | 9723 ms | 56 ms
|
StoreBid | 3 % | 11006 | 3 | 4 ms | 9723 ms | 53 ms
|
PutCommentAuth | 0 % | 0 | 0 | 0 ms | 0 ms | 0 ms
|
PutComment | 0 % | 1477 | 104 | 3 ms | 3731 ms | 45 ms
|
StoreComment | 0 % | 1357 | 0 | 5 ms | 9346 ms | 55 ms
|
Sell | 0 % | 1616 | 0 | 0 ms | 9629 ms | 53 ms
|
SelectCategoryToSellItem | 0 % | 1594 | 0 | 3 ms | 9063 ms | 58 ms
|
SellItemForm | 0 % | 1571 | 0 | 2 ms | 9117 ms | 50 ms
|
RegisterItem | 0 % | 1552 | 0 | 4 ms | 3885 ms | 45 ms
|
AboutMe (auth form) | 1 % | 4872 | 0 | 0 ms | 9373 ms | 33 ms
|
AboutMe | 2 % | 8215 | 0 | 4 ms | 9498 ms | 86 ms
|
Back probability | 10 % | 30855 | 0 | 0 ms | 0 ms | 0 ms
|
End of Session | 1 % | 4234 | 0 | 0 ms | 0 ms | 0 ms
|
Total | 100 % | 294584 | 2687 | - | - | 46 ms
|
Average throughput | 660 req/s
| |||||
Completed sessions | 4231
| |||||
Total time | 1063820 seconds
| |||||
Average session time | 251 seconds
| |||||
| State name | % of total | Count | Errors | Minimum Time | Maximum Time | Average Time |
|---|---|---|---|---|---|---|
Home | 3 % | 387 | 0 | 0 ms | 69 ms | 0 ms
|
Register | 0 % | 93 | 0 | 0 ms | 7 ms | 0 ms
|
RegisterUser | 0 % | 91 | 2 | 5 ms | 50 ms | 11 ms
|
Browse | 6 % | 666 | 0 | 0 ms | 66 ms | 1 ms
|
BrowseCategories | 4 % | 477 | 0 | 3 ms | 46 ms | 8 ms
|
SearchItemsInCategory | 16 % | 1623 | 0 | 3 ms | 269 ms | 10 ms
|
BrowseRegions | 1 % | 192 | 0 | 3 ms | 35 ms | 7 ms
|
BrowseCategoriesInRegion | 2 % | 195 | 0 | 3 ms | 41 ms | 7 ms
|
SearchItemsInRegion | 4 % | 478 | 0 | 0 ms | 306 ms | 24 ms
|
ViewItem | 14 % | 1387 | 0 | 3 ms | 225 ms | 13 ms
|
ViewUserInfo | 3 % | 305 | 0 | 3 ms | 58 ms | 11 ms
|
ViewBidHistory | 1 % | 166 | 0 | 4 ms | 322 ms | 38 ms
|
BuyNowAuth | 1 % | 111 | 0 | 2 ms | 11 ms | 4 ms
|
BuyNow | 1 % | 108 | 8 | 5 ms | 44 ms | 12 ms
|
StoreBuyBow | 0 % | 96 | 0 | 5 ms | 41 ms | 10 ms
|
PutBidAuth | 4 % | 463 | 0 | 0 ms | 78 ms | 4 ms
|
PutBid | 5 % | 557 | 49 | 3 ms | 80 ms | 14 ms
|
StoreBid | 3 % | 380 | 0 | 5 ms | 150 ms | 11 ms
|
PutCommentAuth | 0 % | 0 | 0 | 0 ms | 0 ms | 0 ms
|
PutComment | 0 % | 42 | 3 | 4 ms | 69 ms | 12 ms
|
StoreComment | 0 % | 38 | 0 | 4 ms | 48 ms | 13 ms
|
Sell | 0 % | 66 | 0 | 0 ms | 46 ms | 1 ms
|
SelectCategoryToSellItem | 0 % | 60 | 0 | 4 ms | 45 ms | 10 ms
|
SellItemForm | 0 % | 60 | 0 | 2 ms | 7 ms | 2 ms
|
RegisterItem | 0 % | 51 | 0 | 4 ms | 21 ms | 11 ms
|
AboutMe (auth form) | 1 % | 142 | 0 | 0 ms | 10 ms | 1 ms
|
AboutMe | 2 % | 270 | 0 | 5 ms | 226 ms | 34 ms
|
Back probability | 10 % | 1018 | 0 | 0 ms | 0 ms | 0 ms
|
End of Session | 1 % | 179 | 0 | 0 ms | 0 ms | 0 ms
|
Total | 100 % | 9701 | 62 | - | - | 9 ms
|
Average throughput | 325 req/s
| |||||
Completed sessions | 156
| |||||
Total time | 55445 seconds
| |||||
Average session time | 355 seconds
| |||||
| State name | % of total | Count | Errors | Minimum Time | Maximum Time | Average Time |
|---|---|---|---|---|---|---|
Home | 5 % | 19820 | 0 | 0 ms | 59275 ms | 1811 ms
|
Register | 1 % | 3972 | 0 | 0 ms | 45230 ms | 375 ms
|
RegisterUser | 1 % | 3837 | 48 | 4 ms | 45115 ms | 335 ms
|
Browse | 7 % | 28041 | 0 | 0 ms | 45402 ms | 544 ms
|
BrowseCategories | 5 % | 19348 | 0 | 3 ms | 59114 ms | 428 ms
|
SearchItemsInCategory | 15 % | 57667 | 0 | 0 ms | 45395 ms | 283 ms
|
BrowseRegions | 2 % | 8040 | 0 | 3 ms | 45108 ms | 402 ms
|
BrowseCategoriesInRegion | 2 % | 7821 | 0 | 3 ms | 45188 ms | 431 ms
|
SearchItemsInRegion | 5 % | 18669 | 0 | 0 ms | 45399 ms | 284 ms
|
ViewItem | 13 % | 51632 | 0 | 3 ms | 45346 ms | 252 ms
|
ViewUserInfo | 3 % | 11426 | 0 | 3 ms | 59114 ms | 222 ms
|
ViewBidHistory | 1 % | 6017 | 0 | 3 ms | 45131 ms | 218 ms
|
BuyNowAuth | 1 % | 4684 | 0 | 2 ms | 45043 ms | 250 ms
|
BuyNow | 1 % | 4550 | 703 | 4 ms | 45057 ms | 183 ms
|
StoreBuyBow | 1 % | 3747 | 1 | 4 ms | 45026 ms | 129 ms
|
PutBidAuth | 4 % | 17960 | 0 | 0 ms | 45444 ms | 261 ms
|
PutBid | 5 % | 20211 | 2401 | 1 ms | 45451 ms | 193 ms
|
StoreBid | 3 % | 12980 | 3 | 4 ms | 45417 ms | 226 ms
|
PutCommentAuth | 0 % | 0 | 0 | 0 ms | 0 ms | 0 ms
|
PutComment | 0 % | 1754 | 123 | 3 ms | 45048 ms | 161 ms
|
StoreComment | 0 % | 1590 | 0 | 4 ms | 45013 ms | 189 ms
|
Sell | 0 % | 2114 | 0 | 0 ms | 59132 ms | 623 ms
|
SelectCategoryToSellItem | 0 % | 2046 | 0 | 3 ms | 45015 ms | 267 ms
|
SellItemForm | 0 % | 1993 | 0 | 2 ms | 45002 ms | 212 ms
|
RegisterItem | 0 % | 1937 | 0 | 4 ms | 45025 ms | 577 ms
|
AboutMe (auth form) | 1 % | 6459 | 0 | 0 ms | 59101 ms | 410 ms
|
AboutMe | 2 % | 10543 | 0 | 4 ms | 45114 ms | 413 ms
|
Back probability | 9 % | 37059 | 0 | 0 ms | 0 ms | 0 ms
|
End of Session | 1 % | 5131 | 0 | 0 ms | 0 ms | 0 ms
|
Total | 100 % | 371048 | 3279 | - | - | 353 ms
|
Average throughput | 623 req/s
| |||||
Completed sessions | 5131
| |||||
Total time | 1190350 seconds
| |||||
Average session time | 231 seconds
| |||||
An error occured while waiting for remote processes termination (Skipping waits)
Command is: /usr/bin/scp farm6.csail.mit.edu:/tmp/client1 /home/drkp/sandbox/txcache/src/RUBiS-1.4.3/bench/2009-3-20@0:57:44//client1.bin
Command is: /usr/bin/ssh -x localhost /bin/bash -c 'LANG=en_GB.UTF-8 /usr/bin/sar -n DEV -n SOCK -rubcw 1 605 -f /home/drkp/sandbox/txcache/src/RUBiS-1.4.3/bench/2009-3-20@0:57:44//client1.bin > /home/drkp/sandbox/txcache/src/RUBiS-1.4.3/bench/2009-3-20@0:57:44//client1'
Command is: /usr/bin/scp farm14:/tmp/db_server0 /home/drkp/sandbox/txcache/src/RUBiS-1.4.3/bench/2009-3-20@0:57:44//db_server0.bin
Command is: /usr/bin/ssh -x localhost /bin/bash -c 'LANG=en_GB.UTF-8 /usr/bin/sar -n DEV -n SOCK -rubcw 1 605 -f /home/drkp/sandbox/txcache/src/RUBiS-1.4.3/bench/2009-3-20@0:57:44//db_server0.bin > /home/drkp/sandbox/txcache/src/RUBiS-1.4.3/bench/2009-3-20@0:57:44//db_server0'
Command is: /usr/bin/scp farm12.csail.mit.edu:/tmp/web_server0 /home/drkp/sandbox/txcache/src/RUBiS-1.4.3/bench/2009-3-20@0:57:44//web_server0.bin
Command is: /usr/bin/ssh -x localhost /bin/bash -c 'LANG=en_GB.UTF-8 /usr/bin/sar -n DEV -n SOCK -rubcw 1 605 -f /home/drkp/sandbox/txcache/src/RUBiS-1.4.3/bench/2009-3-20@0:57:44//web_server0.bin > /home/drkp/sandbox/txcache/src/RUBiS-1.4.3/bench/2009-3-20@0:57:44//web_server0'
Command is: /usr/bin/scp farm13.csail.mit.edu:/tmp/web_server1 /home/drkp/sandbox/txcache/src/RUBiS-1.4.3/bench/2009-3-20@0:57:44//web_server1.bin
Command is: /usr/bin/ssh -x localhost /bin/bash -c 'LANG=en_GB.UTF-8 /usr/bin/sar -n DEV -n SOCK -rubcw 1 605 -f /home/drkp/sandbox/txcache/src/RUBiS-1.4.3/bench/2009-3-20@0:57:44//web_server1.bin > /home/drkp/sandbox/txcache/src/RUBiS-1.4.3/bench/2009-3-20@0:57:44//web_server1'
Command is: /usr/bin/scp localhost:/tmp/client0 /home/drkp/sandbox/txcache/src/RUBiS-1.4.3/bench/2009-3-20@0:57:44//client0.bin
Command is: /usr/bin/ssh -x localhost /bin/bash -c 'LANG=en_GB.UTF-8 /usr/bin/sar -n DEV -n SOCK -rubcw 1 605 -f /home/drkp/sandbox/txcache/src/RUBiS-1.4.3/bench/2009-3-20@0:57:44//client0.bin > /home/drkp/sandbox/txcache/src/RUBiS-1.4.3/bench/2009-3-20@0:57:44//client0'
Command is: /usr/bin/scp farm6.csail.mit.edu:/tmp/trace_client1.html /home/drkp/sandbox/txcache/src/RUBiS-1.4.3/bench/2009-3-20@0:57:44//
Command is: /usr/bin/scp farm6.csail.mit.edu:/tmp/stat_client1.html /home/drkp/sandbox/txcache/src/RUBiS-1.4.3/bench/2009-3-20@0:57:44//
|
|
|
|
|
|
 | 
|
 | 
|
 | 
|
 | 
|
 | 
|
 | 
|
 | 
|
 | 
|
 | 
|