Node information
Test timing information
Up ramp statistics
Runtime session statistics
Down ramp statistics
Overall statistics
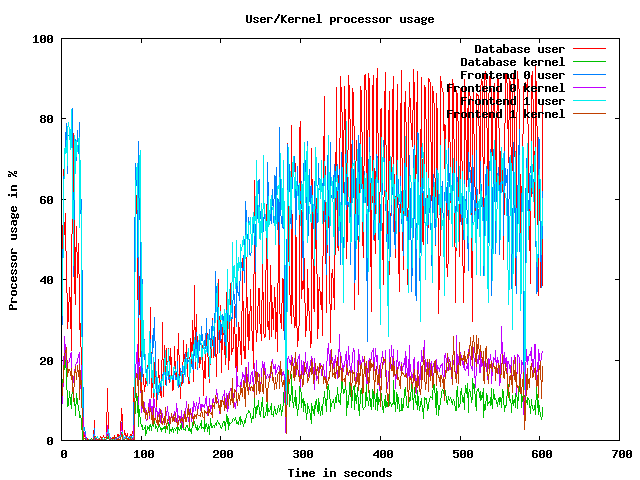
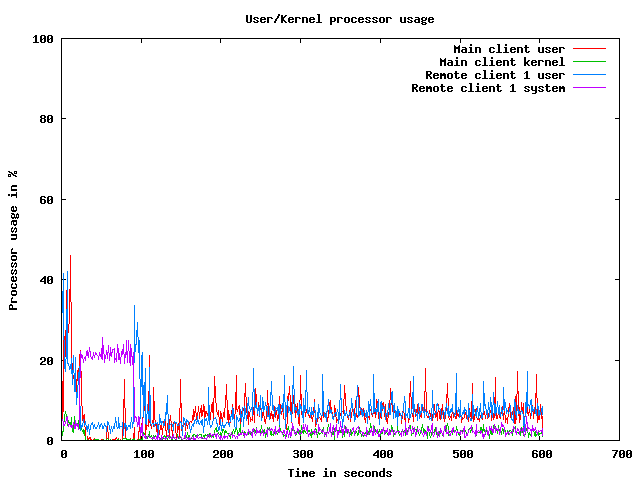
CPU usage graphs
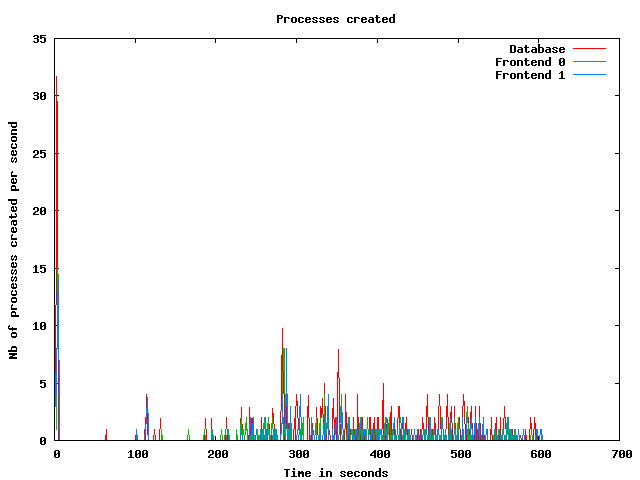
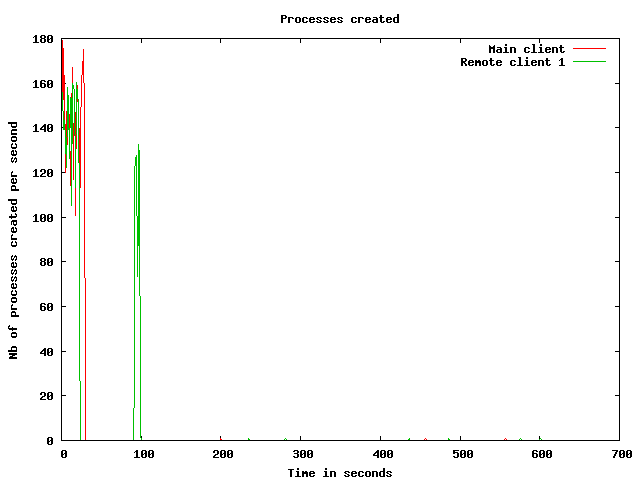
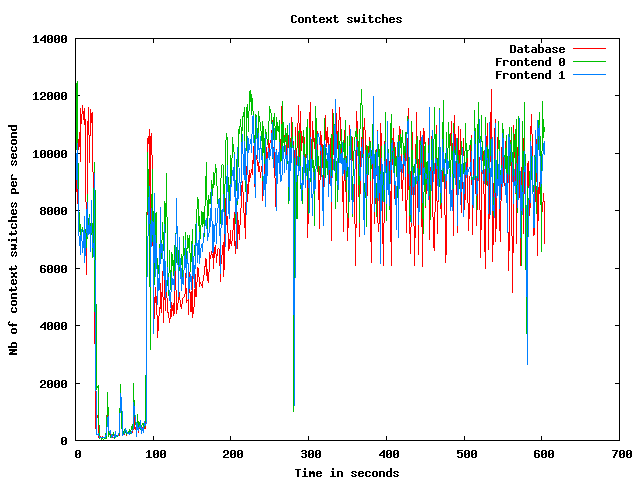
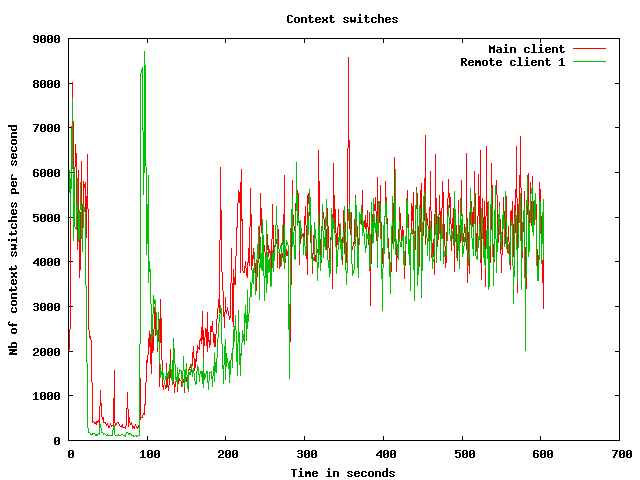
Processes usage graphs
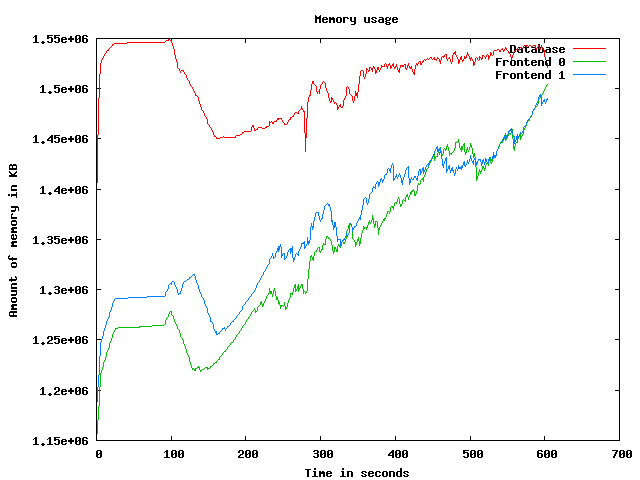
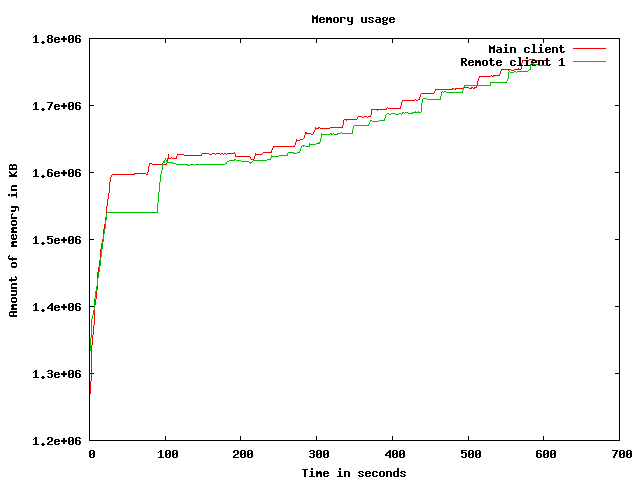
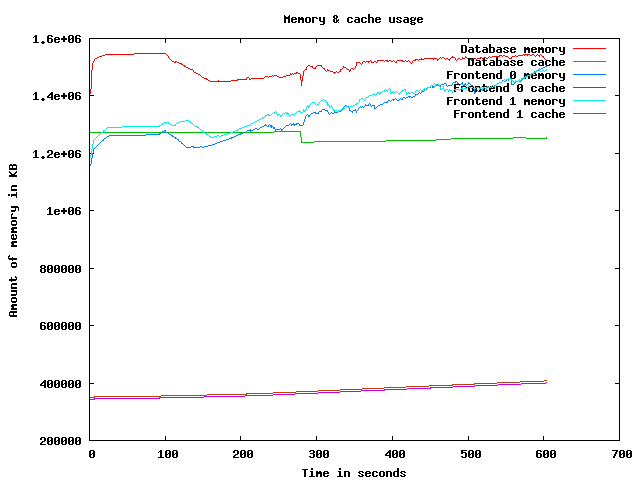
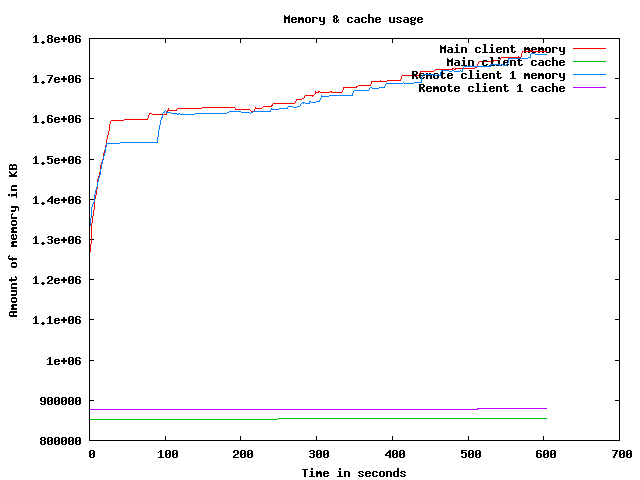
Memory usage graph
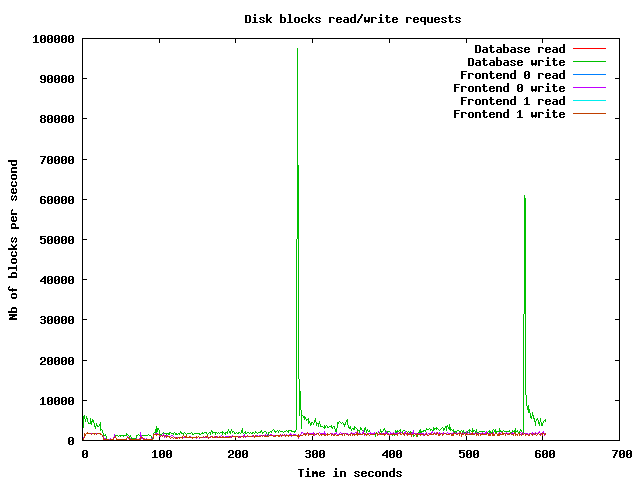
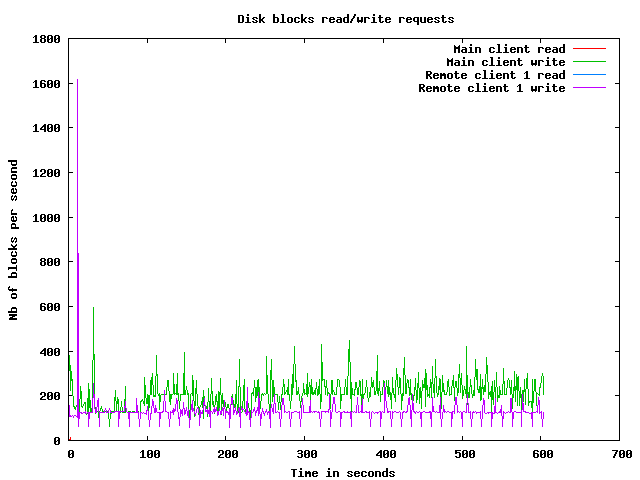
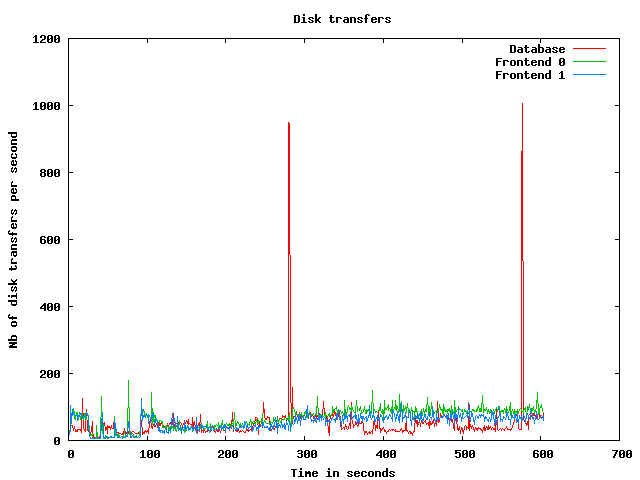
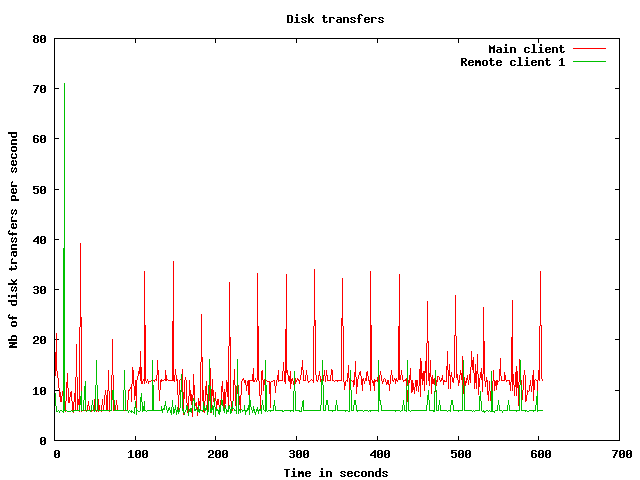
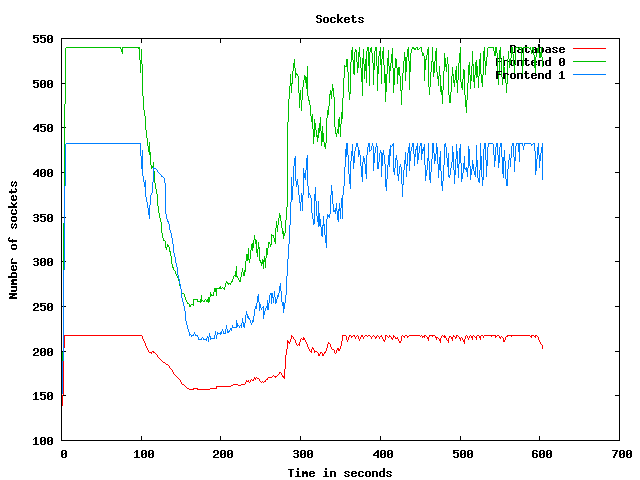
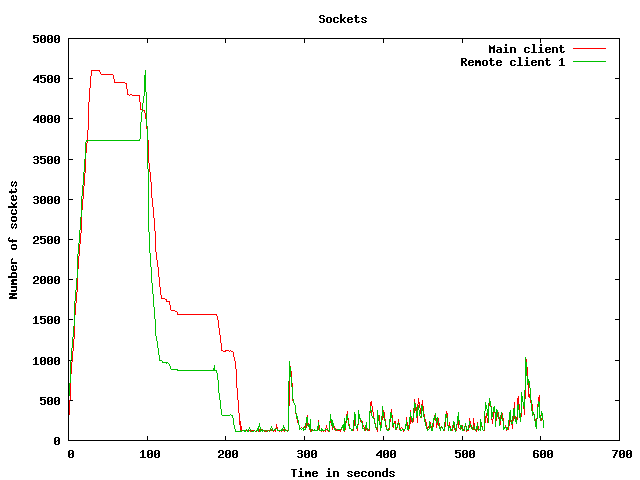
Disk usage graphs
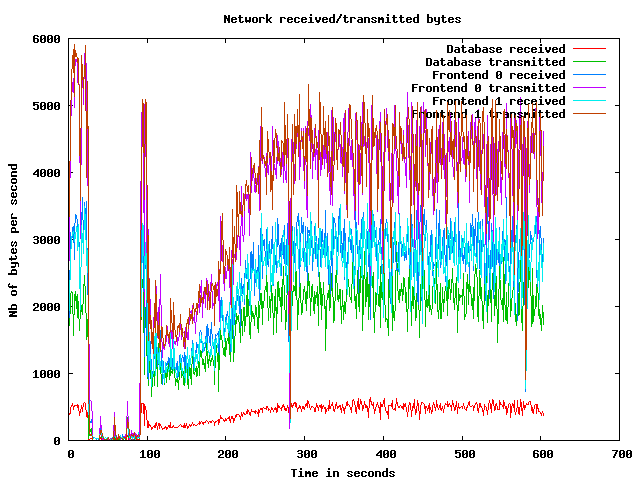
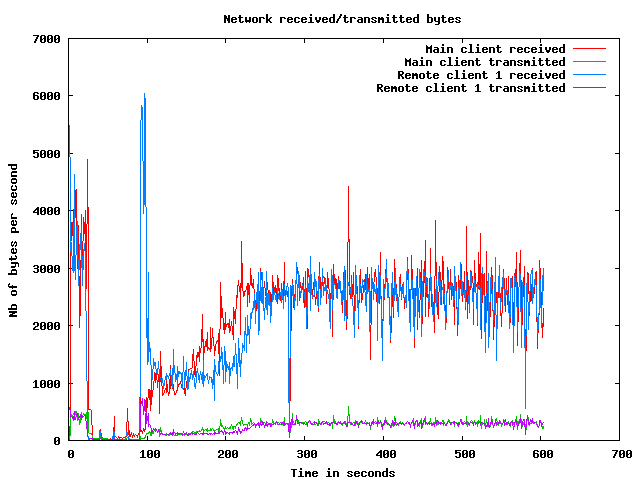
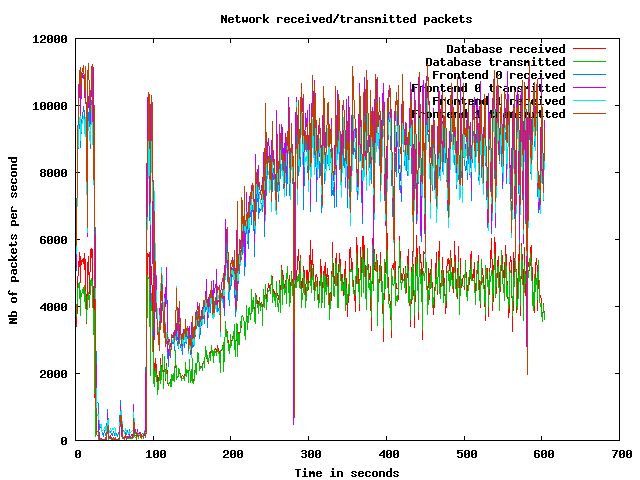
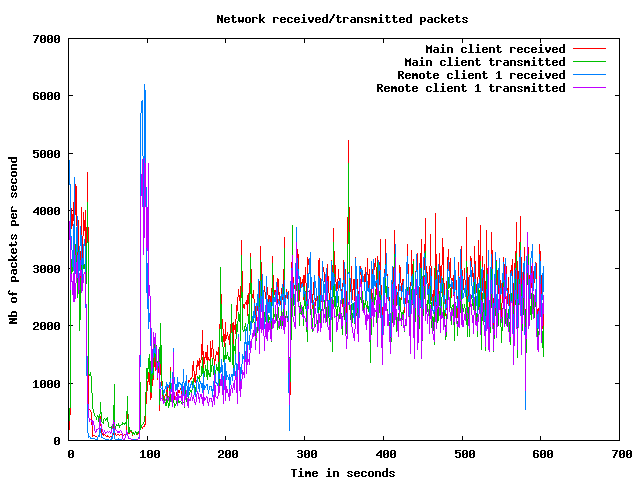
Network usage graphs
| Test start | 2009-3-20 1:11:3 |
| Up ramp start | 2009-3-20 1:11:35 |
| Runtime session start | 2009-3-20 1:13:35 |
| Down ramp start | 2009-3-20 1:21:5 |
| Test end | 2009-3-20 1:23:37 |
| Up ramp length | 2 minutes 0 millisecond (requested 120000 ms) |
| Runtime session length | 7 minutes 30 seconds 1 millisecond (requested 450000 ms) |
| Down ramp length | 30 seconds 0 millisecond (requested 30000 ms) |
| Total test length | 12 minutes 34 seconds 376 milliseconds |
| State name | % of total | Count | Errors | Minimum Time | Maximum Time | Average Time |
|---|---|---|---|---|---|---|
Home | 13 % | 5830 | 0 | 0 ms | 133431 ms | 11962 ms
|
Register | 1 % | 628 | 0 | 0 ms | 103190 ms | 6816 ms
|
RegisterUser | 1 % | 572 | 11 | 5 ms | 123971 ms | 5108 ms
|
Browse | 10 % | 4823 | 0 | 0 ms | 129934 ms | 7318 ms
|
BrowseCategories | 6 % | 3079 | 0 | 3 ms | 129940 ms | 5252 ms
|
SearchItemsInCategory | 14 % | 6361 | 0 | 3 ms | 129945 ms | 5735 ms
|
BrowseRegions | 2 % | 1246 | 0 | 3 ms | 124500 ms | 5575 ms
|
BrowseCategoriesInRegion | 2 % | 1111 | 0 | 3 ms | 129954 ms | 5459 ms
|
SearchItemsInRegion | 4 % | 1938 | 0 | 0 ms | 129950 ms | 5783 ms
|
ViewItem | 11 % | 4905 | 0 | 3 ms | 129954 ms | 5871 ms
|
ViewUserInfo | 1 % | 844 | 0 | 3 ms | 95061 ms | 6160 ms
|
ViewBidHistory | 1 % | 453 | 0 | 4 ms | 129979 ms | 5020 ms
|
BuyNowAuth | 0 % | 421 | 0 | 2 ms | 129953 ms | 6697 ms
|
BuyNow | 0 % | 362 | 49 | 5 ms | 103241 ms | 4995 ms
|
StoreBuyBow | 0 % | 263 | 0 | 5 ms | 106608 ms | 6980 ms
|
PutBidAuth | 3 % | 1666 | 0 | 0 ms | 123946 ms | 4567 ms
|
PutBid | 3 % | 1588 | 210 | 4 ms | 121496 ms | 4958 ms
|
StoreBid | 2 % | 887 | 0 | 4 ms | 129941 ms | 6174 ms
|
PutCommentAuth | 0 % | 0 | 0 | 0 ms | 0 ms | 0 ms
|
PutComment | 0 % | 133 | 10 | 4 ms | 93075 ms | 2845 ms
|
StoreComment | 0 % | 104 | 0 | 5 ms | 93007 ms | 2197 ms
|
Sell | 0 % | 357 | 0 | 0 ms | 103274 ms | 6906 ms
|
SelectCategoryToSellItem | 0 % | 309 | 0 | 4 ms | 94599 ms | 6669 ms
|
SellItemForm | 0 % | 273 | 0 | 2 ms | 93407 ms | 4055 ms
|
RegisterItem | 0 % | 240 | 0 | 4 ms | 93076 ms | 4569 ms
|
AboutMe (auth form) | 2 % | 1035 | 0 | 0 ms | 129937 ms | 8509 ms
|
AboutMe | 2 % | 1301 | 0 | 4 ms | 129965 ms | 6152 ms
|
Back probability | 6 % | 2964 | 0 | 0 ms | 0 ms | 0 ms
|
End of Session | 0 % | 411 | 0 | 0 ms | 0 ms | 0 ms
|
Total | 100 % | 44104 | 280 | - | - | 6240 ms
|
Average throughput | 369 req/s
| |||||
Completed sessions | 368
| |||||
Total time | 13253 seconds
| |||||
Average session time | 36 seconds
| |||||
| State name | % of total | Count | Errors | Minimum Time | Maximum Time | Average Time |
|---|---|---|---|---|---|---|
Home | 4 % | 13648 | 0 | 0 ms | 221024 ms | 7980 ms
|
Register | 1 % | 3364 | 0 | 0 ms | 190280 ms | 1111 ms
|
RegisterUser | 1 % | 3290 | 91 | 5 ms | 190061 ms | 1083 ms
|
Browse | 7 % | 22419 | 0 | 0 ms | 225065 ms | 1981 ms
|
BrowseCategories | 4 % | 15721 | 0 | 3 ms | 190466 ms | 1222 ms
|
SearchItemsInCategory | 15 % | 49539 | 0 | 1 ms | 190752 ms | 760 ms
|
BrowseRegions | 2 % | 6526 | 0 | 3 ms | 190795 ms | 1161 ms
|
BrowseCategoriesInRegion | 2 % | 6414 | 0 | 3 ms | 190516 ms | 786 ms
|
SearchItemsInRegion | 5 % | 15952 | 0 | 0 ms | 190066 ms | 520 ms
|
ViewItem | 14 % | 44580 | 0 | 3 ms | 217954 ms | 444 ms
|
ViewUserInfo | 3 % | 10483 | 0 | 3 ms | 190070 ms | 474 ms
|
ViewBidHistory | 1 % | 5298 | 0 | 3 ms | 190171 ms | 644 ms
|
BuyNowAuth | 1 % | 4190 | 0 | 2 ms | 190017 ms | 483 ms
|
BuyNow | 1 % | 4113 | 626 | 4 ms | 190132 ms | 308 ms
|
StoreBuyBow | 1 % | 3386 | 2 | 5 ms | 190017 ms | 361 ms
|
PutBidAuth | 4 % | 15618 | 0 | 0 ms | 190039 ms | 475 ms
|
PutBid | 5 % | 17832 | 2101 | 1 ms | 190184 ms | 461 ms
|
StoreBid | 3 % | 11577 | 11 | 4 ms | 190061 ms | 371 ms
|
PutCommentAuth | 0 % | 0 | 0 | 0 ms | 0 ms | 0 ms
|
PutComment | 0 % | 1536 | 129 | 4 ms | 190055 ms | 417 ms
|
StoreComment | 0 % | 1382 | 0 | 4 ms | 190029 ms | 420 ms
|
Sell | 0 % | 1691 | 0 | 0 ms | 190663 ms | 2611 ms
|
SelectCategoryToSellItem | 0 % | 1683 | 0 | 4 ms | 190503 ms | 1389 ms
|
SellItemForm | 0 % | 1659 | 0 | 2 ms | 190008 ms | 439 ms
|
RegisterItem | 0 % | 1642 | 0 | 4 ms | 190202 ms | 621 ms
|
AboutMe (auth form) | 1 % | 5303 | 0 | 0 ms | 190303 ms | 1940 ms
|
AboutMe | 2 % | 8891 | 0 | 4 ms | 190462 ms | 924 ms
|
Back probability | 10 % | 32906 | 0 | 0 ms | 0 ms | 0 ms
|
End of Session | 1 % | 4483 | 0 | 0 ms | 0 ms | 0 ms
|
Total | 100 % | 315126 | 2960 | - | - | 1004 ms
|
Average throughput | 706 req/s
| |||||
Completed sessions | 4458
| |||||
Total time | 1185204 seconds
| |||||
Average session time | 265 seconds
| |||||
| State name | % of total | Count | Errors | Minimum Time | Maximum Time | Average Time |
|---|---|---|---|---|---|---|
Home | 4 % | 459 | 0 | 0 ms | 3029 ms | 27 ms
|
Register | 1 % | 115 | 0 | 0 ms | 21499 ms | 368 ms
|
RegisterUser | 1 % | 117 | 1 | 6 ms | 3814 ms | 257 ms
|
Browse | 6 % | 746 | 0 | 0 ms | 21825 ms | 189 ms
|
BrowseCategories | 4 % | 505 | 0 | 3 ms | 4938 ms | 160 ms
|
SearchItemsInCategory | 15 % | 1702 | 0 | 3 ms | 5522 ms | 179 ms
|
BrowseRegions | 1 % | 213 | 0 | 3 ms | 4341 ms | 178 ms
|
BrowseCategoriesInRegion | 1 % | 217 | 0 | 3 ms | 3032 ms | 63 ms
|
SearchItemsInRegion | 5 % | 573 | 0 | 0 ms | 45041 ms | 400 ms
|
ViewItem | 14 % | 1621 | 0 | 3 ms | 22346 ms | 196 ms
|
ViewUserInfo | 3 % | 352 | 0 | 3 ms | 21449 ms | 200 ms
|
ViewBidHistory | 1 % | 176 | 0 | 4 ms | 4479 ms | 470 ms
|
BuyNowAuth | 1 % | 146 | 0 | 2 ms | 4898 ms | 180 ms
|
BuyNow | 1 % | 145 | 18 | 5 ms | 1107 ms | 43 ms
|
StoreBuyBow | 1 % | 128 | 1 | 5 ms | 3236 ms | 144 ms
|
PutBidAuth | 5 % | 572 | 0 | 0 ms | 3802 ms | 126 ms
|
PutBid | 5 % | 633 | 74 | 4 ms | 4275 ms | 121 ms
|
StoreBid | 3 % | 416 | 0 | 5 ms | 21422 ms | 167 ms
|
PutCommentAuth | 0 % | 0 | 0 | 0 ms | 0 ms | 0 ms
|
PutComment | 0 % | 53 | 8 | 5 ms | 3199 ms | 160 ms
|
StoreComment | 0 % | 51 | 0 | 6 ms | 21428 ms | 571 ms
|
Sell | 0 % | 55 | 0 | 0 ms | 3072 ms | 97 ms
|
SelectCategoryToSellItem | 0 % | 54 | 0 | 5 ms | 3154 ms | 137 ms
|
SellItemForm | 0 % | 54 | 0 | 2 ms | 3205 ms | 119 ms
|
RegisterItem | 0 % | 44 | 0 | 5 ms | 3024 ms | 245 ms
|
AboutMe (auth form) | 1 % | 181 | 0 | 0 ms | 4910 ms | 111 ms
|
AboutMe | 3 % | 348 | 0 | 4 ms | 21676 ms | 238 ms
|
Back probability | 10 % | 1213 | 0 | 0 ms | 0 ms | 0 ms
|
End of Session | 1 % | 156 | 0 | 0 ms | 0 ms | 0 ms
|
Total | 100 % | 11045 | 102 | - | - | 162 ms
|
Average throughput | 371 req/s
| |||||
Completed sessions | 144
| |||||
Total time | 49472 seconds
| |||||
Average session time | 343 seconds
| |||||
| State name | % of total | Count | Errors | Minimum Time | Maximum Time | Average Time |
|---|---|---|---|---|---|---|
Home | 5 % | 19937 | 0 | 0 ms | 221024 ms | 8962 ms
|
Register | 1 % | 4107 | 0 | 0 ms | 190280 ms | 1962 ms
|
RegisterUser | 1 % | 3979 | 103 | 5 ms | 190061 ms | 1638 ms
|
Browse | 7 % | 27988 | 0 | 0 ms | 225065 ms | 2853 ms
|
BrowseCategories | 5 % | 19305 | 0 | 3 ms | 190466 ms | 1837 ms
|
SearchItemsInCategory | 15 % | 57827 | 0 | 1 ms | 190752 ms | 1287 ms
|
BrowseRegions | 2 % | 7985 | 0 | 3 ms | 190795 ms | 1823 ms
|
BrowseCategoriesInRegion | 2 % | 7742 | 0 | 3 ms | 190516 ms | 1437 ms
|
SearchItemsInRegion | 4 % | 18524 | 0 | 0 ms | 190066 ms | 1065 ms
|
ViewItem | 13 % | 51207 | 0 | 3 ms | 217954 ms | 955 ms
|
ViewUserInfo | 3 % | 11715 | 0 | 3 ms | 190070 ms | 874 ms
|
ViewBidHistory | 1 % | 5950 | 0 | 3 ms | 190171 ms | 969 ms
|
BuyNowAuth | 1 % | 4757 | 0 | 2 ms | 190017 ms | 1023 ms
|
BuyNow | 1 % | 4620 | 693 | 4 ms | 190132 ms | 667 ms
|
StoreBuyBow | 1 % | 3777 | 3 | 5 ms | 190017 ms | 815 ms
|
PutBidAuth | 4 % | 17856 | 0 | 0 ms | 190039 ms | 845 ms
|
PutBid | 5 % | 20112 | 2385 | 1 ms | 190184 ms | 804 ms
|
StoreBid | 3 % | 12880 | 11 | 4 ms | 190061 ms | 764 ms
|
PutCommentAuth | 0 % | 0 | 0 | 0 ms | 0 ms | 0 ms
|
PutComment | 0 % | 1722 | 147 | 4 ms | 190055 ms | 596 ms
|
StoreComment | 0 % | 1537 | 0 | 4 ms | 190029 ms | 545 ms
|
Sell | 0 % | 2103 | 0 | 0 ms | 190663 ms | 3274 ms
|
SelectCategoryToSellItem | 0 % | 2046 | 0 | 4 ms | 190503 ms | 2154 ms
|
SellItemForm | 0 % | 1986 | 0 | 2 ms | 190008 ms | 927 ms
|
RegisterItem | 0 % | 1926 | 0 | 4 ms | 190202 ms | 1105 ms
|
AboutMe (auth form) | 1 % | 6519 | 0 | 0 ms | 190303 ms | 2932 ms
|
AboutMe | 2 % | 10600 | 0 | 4 ms | 190462 ms | 1538 ms
|
Back probability | 9 % | 37083 | 0 | 0 ms | 0 ms | 0 ms
|
End of Session | 1 % | 5050 | 0 | 0 ms | 0 ms | 0 ms
|
Total | 100 % | 370840 | 3342 | - | - | 1598 ms
|
Average throughput | 623 req/s
| |||||
Completed sessions | 5050
| |||||
Total time | 1279245 seconds
| |||||
Average session time | 253 seconds
| |||||
An error occured while waiting for remote processes termination (Skipping waits)
Command is: /usr/bin/scp farm6.csail.mit.edu:/tmp/client1 /home/drkp/sandbox/txcache/src/RUBiS-1.4.3/bench/2009-3-20@1:11:3//client1.bin
Command is: /usr/bin/ssh -x localhost /bin/bash -c 'LANG=en_GB.UTF-8 /usr/bin/sar -n DEV -n SOCK -rubcw 1 605 -f /home/drkp/sandbox/txcache/src/RUBiS-1.4.3/bench/2009-3-20@1:11:3//client1.bin > /home/drkp/sandbox/txcache/src/RUBiS-1.4.3/bench/2009-3-20@1:11:3//client1'
Command is: /usr/bin/scp farm14:/tmp/db_server0 /home/drkp/sandbox/txcache/src/RUBiS-1.4.3/bench/2009-3-20@1:11:3//db_server0.bin
Command is: /usr/bin/ssh -x localhost /bin/bash -c 'LANG=en_GB.UTF-8 /usr/bin/sar -n DEV -n SOCK -rubcw 1 605 -f /home/drkp/sandbox/txcache/src/RUBiS-1.4.3/bench/2009-3-20@1:11:3//db_server0.bin > /home/drkp/sandbox/txcache/src/RUBiS-1.4.3/bench/2009-3-20@1:11:3//db_server0'
Command is: /usr/bin/scp farm12.csail.mit.edu:/tmp/web_server0 /home/drkp/sandbox/txcache/src/RUBiS-1.4.3/bench/2009-3-20@1:11:3//web_server0.bin
Command is: /usr/bin/ssh -x localhost /bin/bash -c 'LANG=en_GB.UTF-8 /usr/bin/sar -n DEV -n SOCK -rubcw 1 605 -f /home/drkp/sandbox/txcache/src/RUBiS-1.4.3/bench/2009-3-20@1:11:3//web_server0.bin > /home/drkp/sandbox/txcache/src/RUBiS-1.4.3/bench/2009-3-20@1:11:3//web_server0'
Command is: /usr/bin/scp farm13.csail.mit.edu:/tmp/web_server1 /home/drkp/sandbox/txcache/src/RUBiS-1.4.3/bench/2009-3-20@1:11:3//web_server1.bin
Command is: /usr/bin/ssh -x localhost /bin/bash -c 'LANG=en_GB.UTF-8 /usr/bin/sar -n DEV -n SOCK -rubcw 1 605 -f /home/drkp/sandbox/txcache/src/RUBiS-1.4.3/bench/2009-3-20@1:11:3//web_server1.bin > /home/drkp/sandbox/txcache/src/RUBiS-1.4.3/bench/2009-3-20@1:11:3//web_server1'
Command is: /usr/bin/scp localhost:/tmp/client0 /home/drkp/sandbox/txcache/src/RUBiS-1.4.3/bench/2009-3-20@1:11:3//client0.bin
Command is: /usr/bin/ssh -x localhost /bin/bash -c 'LANG=en_GB.UTF-8 /usr/bin/sar -n DEV -n SOCK -rubcw 1 605 -f /home/drkp/sandbox/txcache/src/RUBiS-1.4.3/bench/2009-3-20@1:11:3//client0.bin > /home/drkp/sandbox/txcache/src/RUBiS-1.4.3/bench/2009-3-20@1:11:3//client0'
Command is: /usr/bin/scp farm6.csail.mit.edu:/tmp/trace_client1.html /home/drkp/sandbox/txcache/src/RUBiS-1.4.3/bench/2009-3-20@1:11:3//
Command is: /usr/bin/scp farm6.csail.mit.edu:/tmp/stat_client1.html /home/drkp/sandbox/txcache/src/RUBiS-1.4.3/bench/2009-3-20@1:11:3//
|
|
|
|
|
|
 | 
|
 | 
|
 | 
|
 | 
|
 | 
|
 | 
|
 | 
|
 | 
|
 | 
|