Node information
Test timing information
Up ramp statistics
Runtime session statistics
Down ramp statistics
Overall statistics
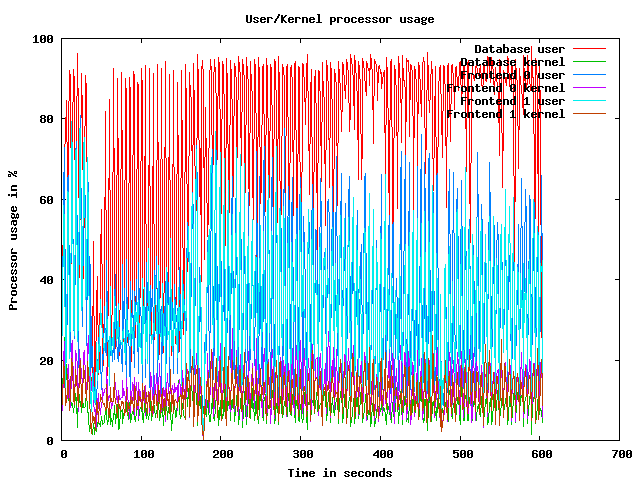
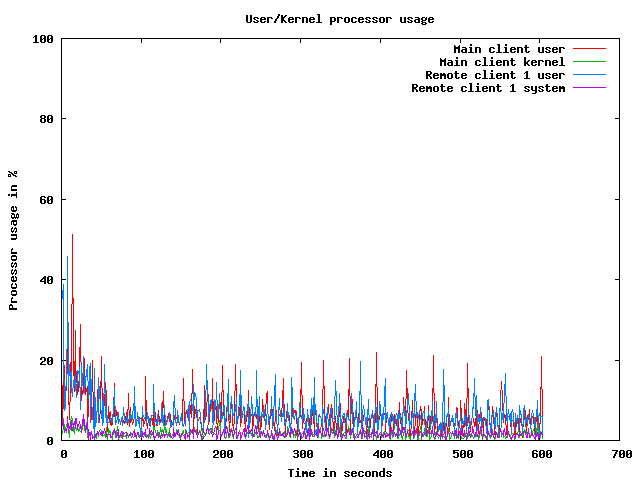
CPU usage graphs
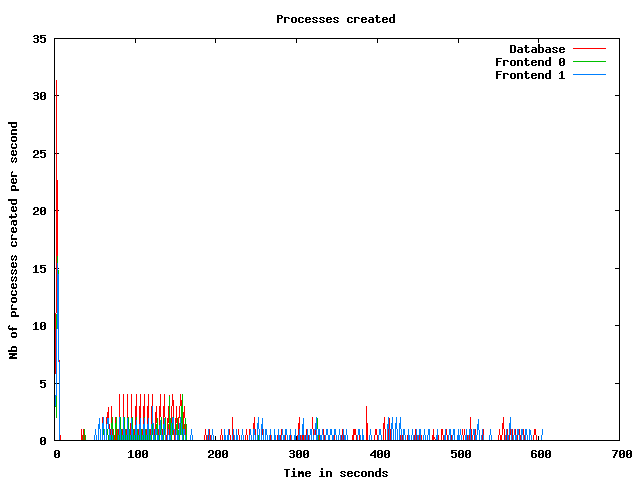
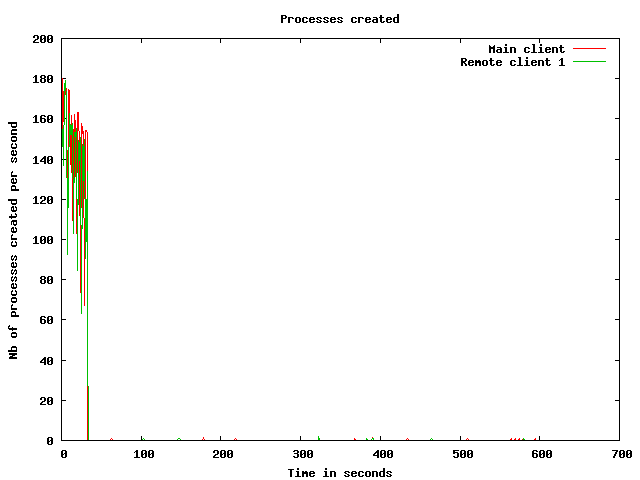
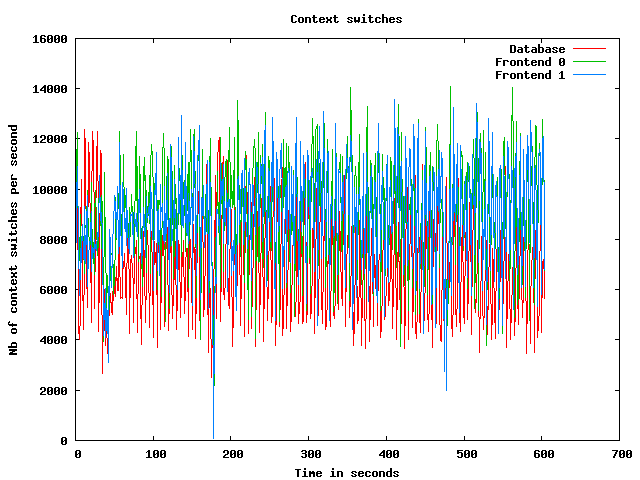
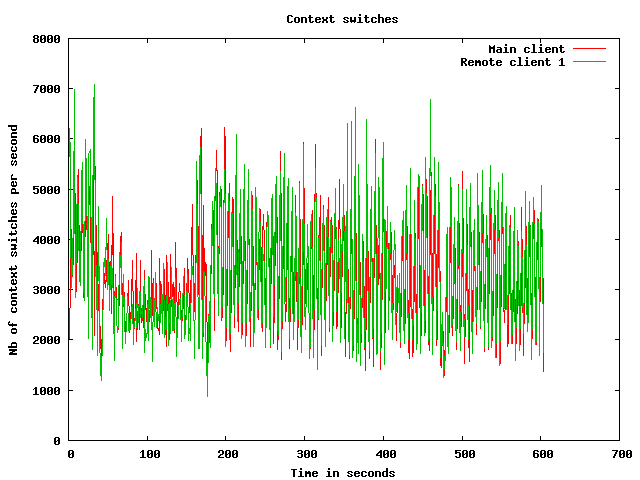
Processes usage graphs
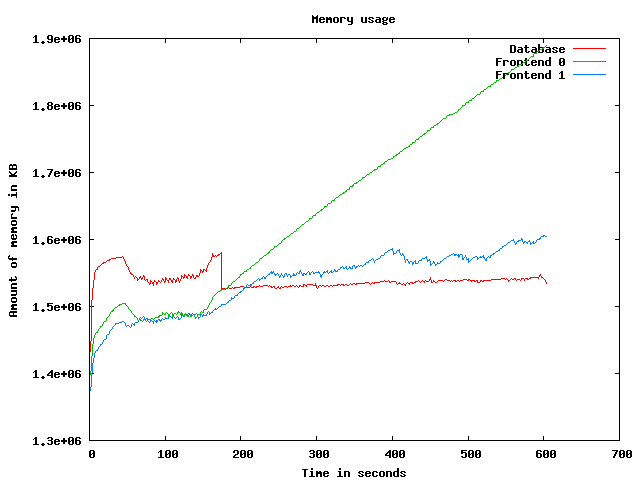
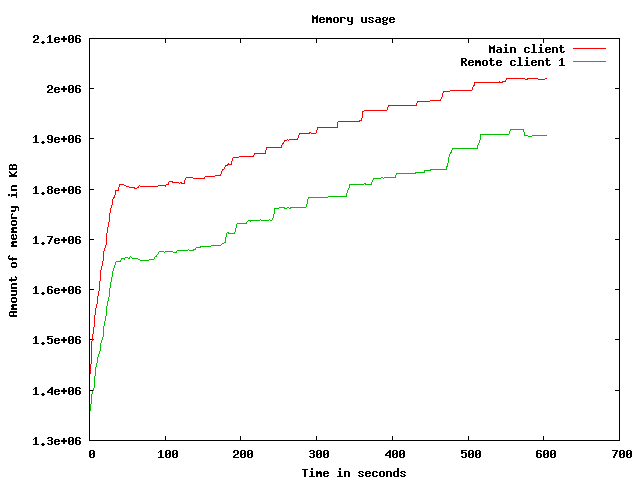
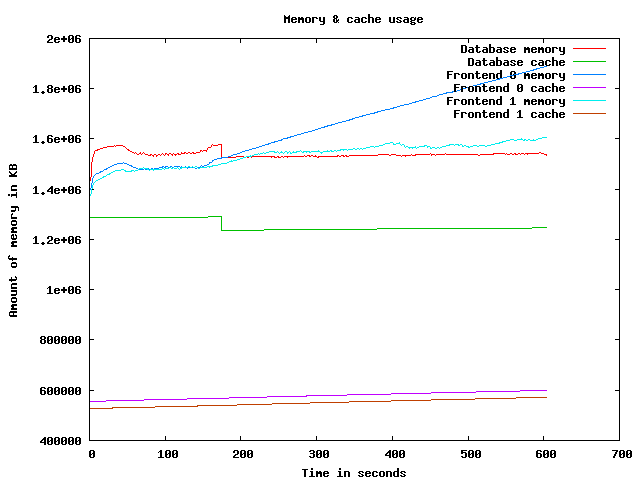
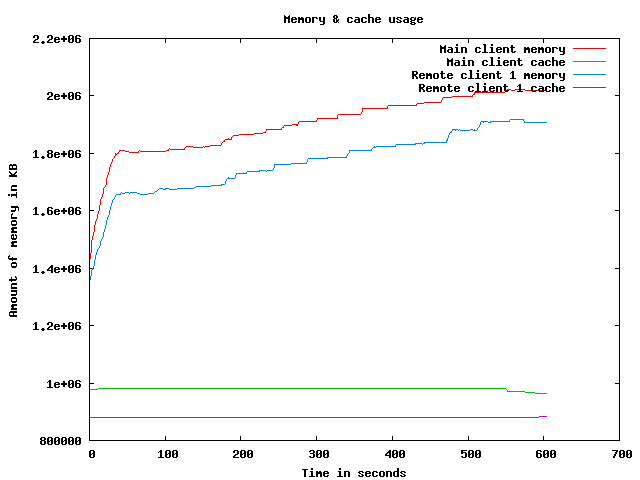
Memory usage graph
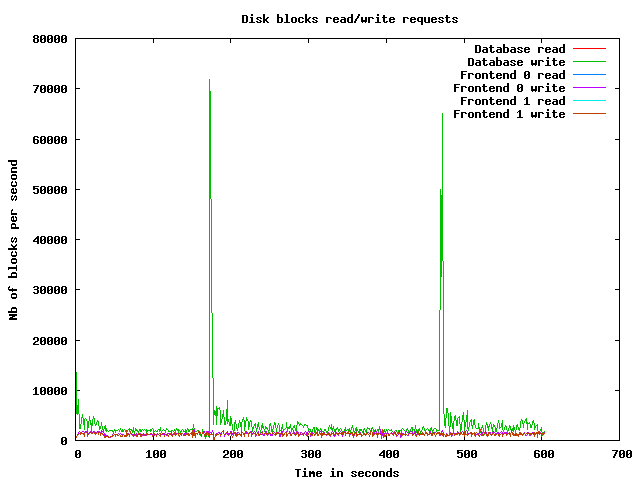
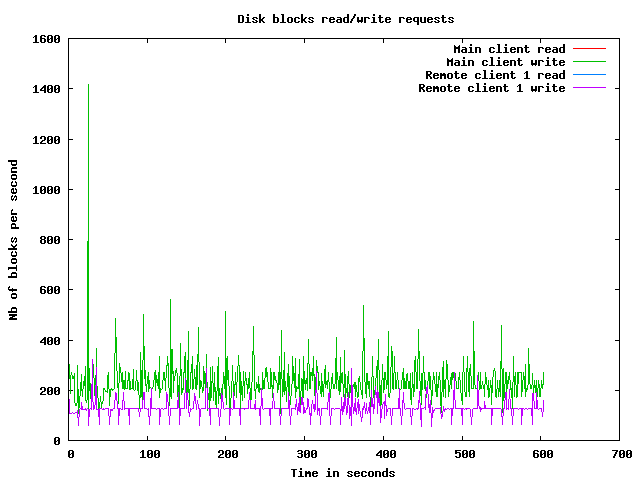
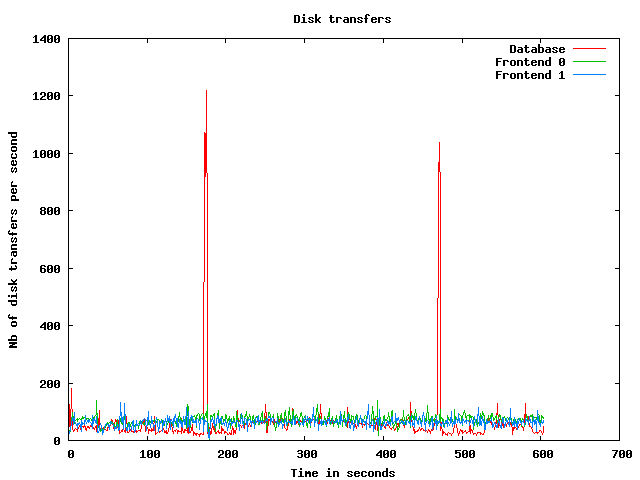
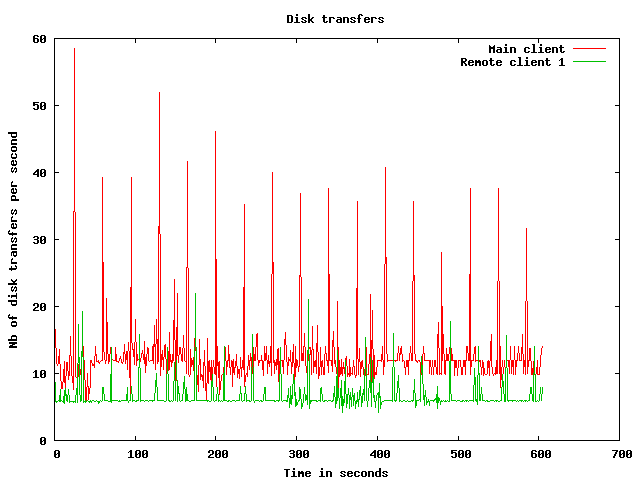
Disk usage graphs
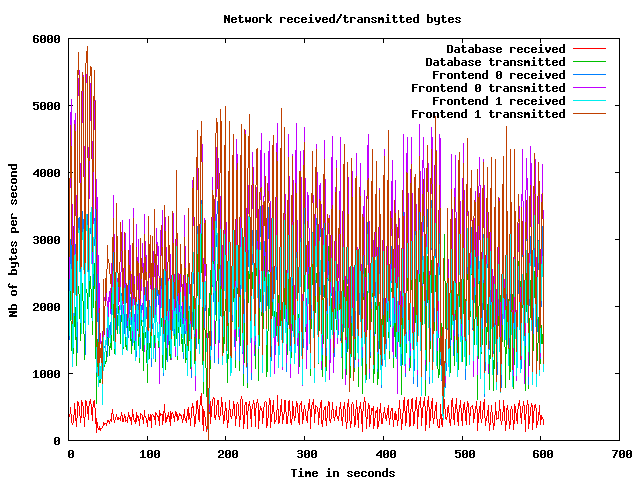
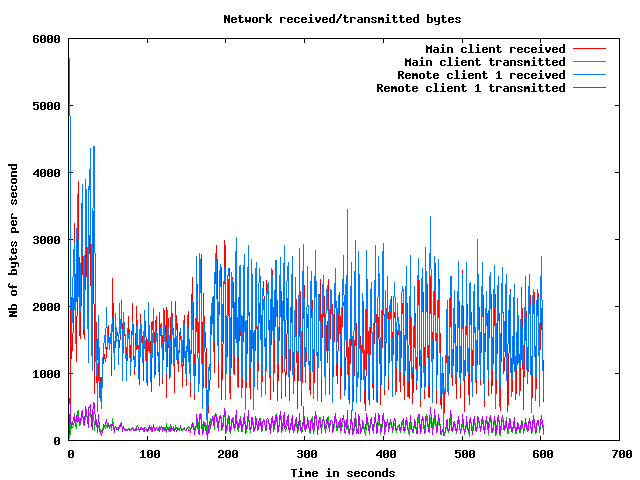
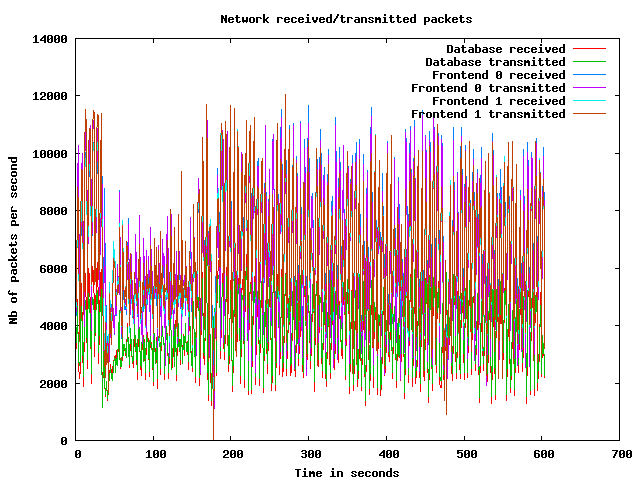
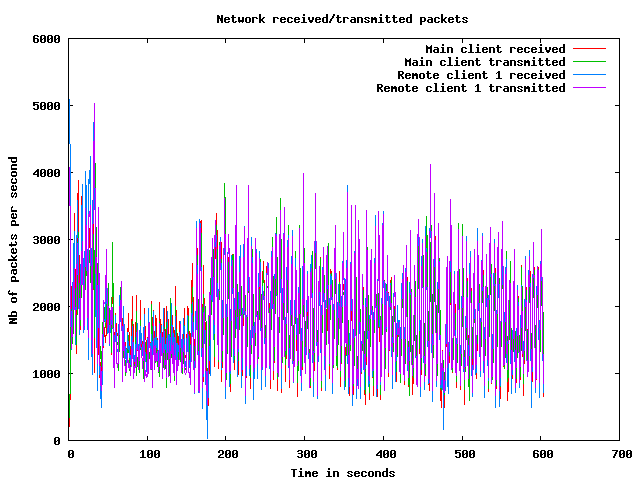
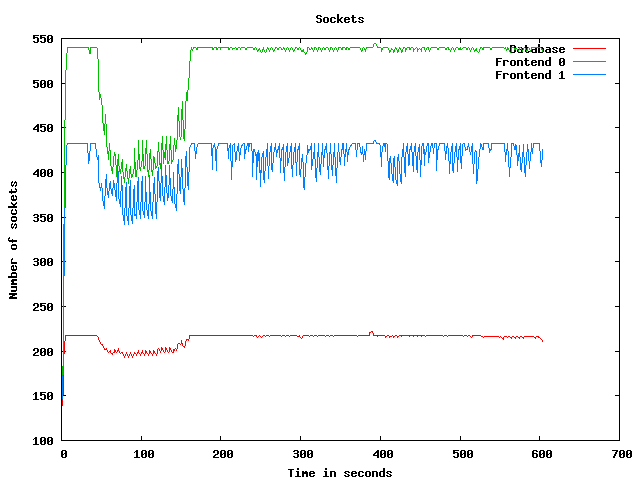
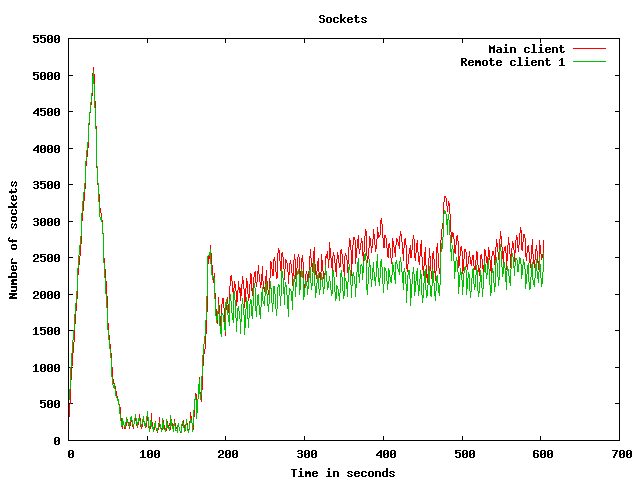
Network usage graphs
| Test start | 2009-3-20 3:13:20 |
| Up ramp start | 2009-3-20 3:13:55 |
| Runtime session start | 2009-3-20 3:15:55 |
| Down ramp start | 2009-3-20 3:23:25 |
| Test end | 2009-3-20 3:26:23 |
| Up ramp length | 2 minutes 1 millisecond (requested 120000 ms) |
| Runtime session length | 7 minutes 30 seconds 0 millisecond (requested 450000 ms) |
| Down ramp length | 30 seconds 0 millisecond (requested 30000 ms) |
| Total test length | 13 minutes 2 seconds 332 milliseconds |
| State name | % of total | Count | Errors | Minimum Time | Maximum Time | Average Time |
|---|---|---|---|---|---|---|
Home | 9 % | 7539 | 0 | 0 ms | 93044 ms | 7563 ms
|
Register | 1 % | 1011 | 0 | 0 ms | 45676 ms | 2336 ms
|
RegisterUser | 1 % | 945 | 32 | 5 ms | 59157 ms | 2140 ms
|
Browse | 9 % | 7510 | 0 | 0 ms | 93024 ms | 2678 ms
|
BrowseCategories | 6 % | 4957 | 0 | 3 ms | 93010 ms | 1915 ms
|
SearchItemsInCategory | 14 % | 11328 | 0 | 1 ms | 93014 ms | 1629 ms
|
BrowseRegions | 2 % | 2066 | 0 | 3 ms | 92998 ms | 1880 ms
|
BrowseCategoriesInRegion | 2 % | 1874 | 0 | 3 ms | 93008 ms | 1586 ms
|
SearchItemsInRegion | 4 % | 3630 | 0 | 0 ms | 93021 ms | 1509 ms
|
ViewItem | 12 % | 9312 | 0 | 3 ms | 93027 ms | 1304 ms
|
ViewUserInfo | 2 % | 1555 | 0 | 3 ms | 45609 ms | 1089 ms
|
ViewBidHistory | 1 % | 832 | 0 | 3 ms | 93026 ms | 1560 ms
|
BuyNowAuth | 1 % | 823 | 0 | 2 ms | 93019 ms | 1216 ms
|
BuyNow | 0 % | 741 | 109 | 5 ms | 45527 ms | 1203 ms
|
StoreBuyBow | 0 % | 538 | 0 | 5 ms | 93024 ms | 1076 ms
|
PutBidAuth | 4 % | 3215 | 0 | 0 ms | 93001 ms | 1160 ms
|
PutBid | 4 % | 3077 | 407 | 4 ms | 93014 ms | 1176 ms
|
StoreBid | 2 % | 1807 | 1 | 4 ms | 45896 ms | 915 ms
|
PutCommentAuth | 0 % | 0 | 0 | 0 ms | 0 ms | 0 ms
|
PutComment | 0 % | 274 | 15 | 5 ms | 45172 ms | 784 ms
|
StoreComment | 0 % | 215 | 0 | 5 ms | 21754 ms | 269 ms
|
Sell | 0 % | 521 | 0 | 0 ms | 45881 ms | 1241 ms
|
SelectCategoryToSellItem | 0 % | 487 | 0 | 4 ms | 45929 ms | 1882 ms
|
SellItemForm | 0 % | 465 | 0 | 2 ms | 45740 ms | 1181 ms
|
RegisterItem | 0 % | 419 | 0 | 4 ms | 45786 ms | 1961 ms
|
AboutMe (auth form) | 2 % | 1709 | 0 | 0 ms | 93005 ms | 2498 ms
|
AboutMe | 3 % | 2306 | 0 | 5 ms | 93055 ms | 1700 ms
|
Back probability | 7 % | 5712 | 0 | 0 ms | 0 ms | 0 ms
|
End of Session | 0 % | 730 | 0 | 0 ms | 0 ms | 0 ms
|
Total | 100 % | 75598 | 564 | - | - | 2098 ms
|
Average throughput | 634 req/s
| |||||
Completed sessions | 657
| |||||
Total time | 42378 seconds
| |||||
Average session time | 64 seconds
| |||||
| State name | % of total | Count | Errors | Minimum Time | Maximum Time | Average Time |
|---|---|---|---|---|---|---|
Home | 4 % | 8509 | 0 | 0 ms | 289809 ms | 2156 ms
|
Register | 1 % | 2042 | 0 | 0 ms | 347420 ms | 4422 ms
|
RegisterUser | 1 % | 2011 | 66 | 5 ms | 384035 ms | 4684 ms
|
Browse | 6 % | 13772 | 0 | 0 ms | 425625 ms | 4942 ms
|
BrowseCategories | 4 % | 9690 | 0 | 3 ms | 384131 ms | 4806 ms
|
SearchItemsInCategory | 15 % | 30947 | 0 | 3 ms | 384142 ms | 5164 ms
|
BrowseRegions | 1 % | 3954 | 0 | 3 ms | 311755 ms | 4399 ms
|
BrowseCategoriesInRegion | 1 % | 3924 | 0 | 3 ms | 383170 ms | 5539 ms
|
SearchItemsInRegion | 5 % | 10111 | 0 | 0 ms | 383908 ms | 5093 ms
|
ViewItem | 14 % | 28290 | 0 | 3 ms | 384178 ms | 4944 ms
|
ViewUserInfo | 3 % | 6665 | 0 | 4 ms | 380142 ms | 4906 ms
|
ViewBidHistory | 1 % | 3511 | 0 | 5 ms | 384037 ms | 5030 ms
|
BuyNowAuth | 1 % | 2636 | 0 | 2 ms | 380009 ms | 4030 ms
|
BuyNow | 1 % | 2583 | 338 | 5 ms | 380116 ms | 5602 ms
|
StoreBuyBow | 1 % | 2215 | 1 | 5 ms | 250812 ms | 4929 ms
|
PutBidAuth | 4 % | 9719 | 0 | 0 ms | 380011 ms | 4885 ms
|
PutBid | 5 % | 11344 | 1314 | 1 ms | 383249 ms | 5120 ms
|
StoreBid | 3 % | 7335 | 5 | 4 ms | 379993 ms | 4429 ms
|
PutCommentAuth | 0 % | 0 | 0 | 0 ms | 0 ms | 0 ms
|
PutComment | 0 % | 915 | 65 | 5 ms | 190626 ms | 4757 ms
|
StoreComment | 0 % | 860 | 0 | 5 ms | 201786 ms | 5915 ms
|
Sell | 0 % | 1079 | 0 | 0 ms | 380001 ms | 5447 ms
|
SelectCategoryToSellItem | 0 % | 1054 | 0 | 4 ms | 288082 ms | 4593 ms
|
SellItemForm | 0 % | 1025 | 0 | 2 ms | 235441 ms | 5369 ms
|
RegisterItem | 0 % | 1000 | 0 | 5 ms | 255856 ms | 3900 ms
|
AboutMe (auth form) | 1 % | 3230 | 0 | 0 ms | 380011 ms | 5043 ms
|
AboutMe | 2 % | 5517 | 0 | 5 ms | 380157 ms | 4733 ms
|
Back probability | 10 % | 21002 | 0 | 0 ms | 0 ms | 0 ms
|
End of Session | 1 % | 2853 | 0 | 0 ms | 0 ms | 0 ms
|
Total | 100 % | 197793 | 1789 | - | - | 4199 ms
|
Average throughput | 443 req/s
| |||||
Completed sessions | 2881
| |||||
Total time | 818338 seconds
| |||||
Average session time | 284 seconds
| |||||
| State name | % of total | Count | Errors | Minimum Time | Maximum Time | Average Time |
|---|---|---|---|---|---|---|
Home | 3 % | 332 | 0 | 0 ms | 249170 ms | 4764 ms
|
Register | 1 % | 100 | 0 | 0 ms | 249170 ms | 16982 ms
|
RegisterUser | 1 % | 88 | 1 | 5 ms | 290073 ms | 11178 ms
|
Browse | 6 % | 575 | 0 | 0 ms | 270800 ms | 9634 ms
|
BrowseCategories | 4 % | 408 | 0 | 3 ms | 249141 ms | 10882 ms
|
SearchItemsInCategory | 14 % | 1274 | 0 | 3 ms | 389298 ms | 12457 ms
|
BrowseRegions | 1 % | 146 | 0 | 3 ms | 249182 ms | 12669 ms
|
BrowseCategoriesInRegion | 1 % | 169 | 0 | 3 ms | 211408 ms | 7306 ms
|
SearchItemsInRegion | 5 % | 427 | 0 | 0 ms | 311414 ms | 12246 ms
|
ViewItem | 14 % | 1234 | 0 | 3 ms | 439653 ms | 11552 ms
|
ViewUserInfo | 3 % | 311 | 0 | 3 ms | 249121 ms | 12661 ms
|
ViewBidHistory | 1 % | 167 | 0 | 7 ms | 249182 ms | 14656 ms
|
BuyNowAuth | 1 % | 117 | 0 | 2 ms | 235169 ms | 15556 ms
|
BuyNow | 1 % | 111 | 18 | 5 ms | 190010 ms | 12731 ms
|
StoreBuyBow | 1 % | 98 | 0 | 5 ms | 249134 ms | 7189 ms
|
PutBidAuth | 5 % | 430 | 0 | 0 ms | 315233 ms | 12339 ms
|
PutBid | 5 % | 486 | 50 | 5 ms | 249199 ms | 11635 ms
|
StoreBid | 3 % | 301 | 0 | 5 ms | 249178 ms | 12532 ms
|
PutCommentAuth | 0 % | 0 | 0 | 0 ms | 0 ms | 0 ms
|
PutComment | 0 % | 50 | 0 | 5 ms | 45085 ms | 1729 ms
|
StoreComment | 0 % | 37 | 0 | 5 ms | 249140 ms | 23618 ms
|
Sell | 0 % | 44 | 0 | 0 ms | 21045 ms | 758 ms
|
SelectCategoryToSellItem | 0 % | 48 | 0 | 4 ms | 211392 ms | 10375 ms
|
SellItemForm | 0 % | 45 | 0 | 2 ms | 99819 ms | 13041 ms
|
RegisterItem | 0 % | 48 | 0 | 5 ms | 212136 ms | 16460 ms
|
AboutMe (auth form) | 1 % | 138 | 0 | 0 ms | 235059 ms | 12336 ms
|
AboutMe | 2 % | 254 | 0 | 12 ms | 384355 ms | 16791 ms
|
Back probability | 11 % | 970 | 0 | 0 ms | 0 ms | 0 ms
|
End of Session | 1 % | 126 | 0 | 0 ms | 0 ms | 0 ms
|
Total | 100 % | 8534 | 69 | - | - | 10063 ms
|
Average throughput | 286 req/s
| |||||
Completed sessions | 113
| |||||
Total time | 52172 seconds
| |||||
Average session time | 461 seconds
| |||||
| State name | % of total | Count | Errors | Minimum Time | Maximum Time | Average Time |
|---|---|---|---|---|---|---|
Home | 5 % | 16393 | 0 | 0 ms | 473009 ms | 4985 ms
|
Register | 1 % | 3170 | 0 | 0 ms | 347420 ms | 4544 ms
|
RegisterUser | 1 % | 3055 | 100 | 5 ms | 384035 ms | 4684 ms
|
Browse | 7 % | 21954 | 0 | 0 ms | 425625 ms | 4971 ms
|
BrowseCategories | 5 % | 15123 | 0 | 3 ms | 473037 ms | 4659 ms
|
SearchItemsInCategory | 15 % | 43939 | 0 | 1 ms | 495934 ms | 5097 ms
|
BrowseRegions | 2 % | 6201 | 0 | 3 ms | 311755 ms | 4312 ms
|
BrowseCategoriesInRegion | 2 % | 5993 | 0 | 3 ms | 383170 ms | 4809 ms
|
SearchItemsInRegion | 5 % | 14278 | 0 | 0 ms | 495966 ms | 5267 ms
|
ViewItem | 13 % | 39134 | 0 | 3 ms | 473023 ms | 4939 ms
|
ViewUserInfo | 3 % | 8617 | 0 | 3 ms | 380142 ms | 5236 ms
|
ViewBidHistory | 1 % | 4549 | 0 | 3 ms | 384037 ms | 5467 ms
|
BuyNowAuth | 1 % | 3589 | 0 | 2 ms | 380009 ms | 4374 ms
|
BuyNow | 1 % | 3452 | 466 | 5 ms | 380116 ms | 5391 ms
|
StoreBuyBow | 1 % | 2863 | 1 | 5 ms | 250812 ms | 5352 ms
|
PutBidAuth | 4 % | 13434 | 0 | 0 ms | 380011 ms | 5038 ms
|
PutBid | 5 % | 15048 | 1778 | 1 ms | 383249 ms | 5214 ms
|
StoreBid | 3 % | 9499 | 6 | 4 ms | 380280 ms | 4782 ms
|
PutCommentAuth | 0 % | 0 | 0 | 0 ms | 0 ms | 0 ms
|
PutComment | 0 % | 1246 | 80 | 5 ms | 190626 ms | 4226 ms
|
StoreComment | 0 % | 1117 | 0 | 5 ms | 249140 ms | 6105 ms
|
Sell | 0 % | 1650 | 0 | 0 ms | 380237 ms | 5060 ms
|
SelectCategoryToSellItem | 0 % | 1601 | 0 | 4 ms | 288082 ms | 4612 ms
|
SellItemForm | 0 % | 1544 | 0 | 2 ms | 235441 ms | 5646 ms
|
RegisterItem | 0 % | 1480 | 0 | 4 ms | 255856 ms | 4358 ms
|
AboutMe (auth form) | 1 % | 5103 | 0 | 0 ms | 380011 ms | 5047 ms
|
AboutMe | 2 % | 8172 | 0 | 5 ms | 473072 ms | 5182 ms
|
Back probability | 9 % | 27831 | 0 | 0 ms | 0 ms | 0 ms
|
End of Session | 1 % | 3727 | 0 | 0 ms | 0 ms | 0 ms
|
Total | 100 % | 283762 | 2431 | - | - | 4403 ms
|
Average throughput | 476 req/s
| |||||
Completed sessions | 3727
| |||||
Total time | 949168 seconds
| |||||
Average session time | 254 seconds
| |||||
An error occured while waiting for remote processes termination (Skipping waits)
Command is: /usr/bin/scp farm6.csail.mit.edu:/tmp/client1 /home/drkp/sandbox/txcache/src/RUBiS-1.4.3/bench/2009-3-20@3:13:20//client1.bin
Command is: /usr/bin/ssh -x localhost /bin/bash -c 'LANG=en_GB.UTF-8 /usr/bin/sar -n DEV -n SOCK -rubcw 1 605 -f /home/drkp/sandbox/txcache/src/RUBiS-1.4.3/bench/2009-3-20@3:13:20//client1.bin > /home/drkp/sandbox/txcache/src/RUBiS-1.4.3/bench/2009-3-20@3:13:20//client1'
Command is: /usr/bin/scp farm14:/tmp/db_server0 /home/drkp/sandbox/txcache/src/RUBiS-1.4.3/bench/2009-3-20@3:13:20//db_server0.bin
Command is: /usr/bin/ssh -x localhost /bin/bash -c 'LANG=en_GB.UTF-8 /usr/bin/sar -n DEV -n SOCK -rubcw 1 605 -f /home/drkp/sandbox/txcache/src/RUBiS-1.4.3/bench/2009-3-20@3:13:20//db_server0.bin > /home/drkp/sandbox/txcache/src/RUBiS-1.4.3/bench/2009-3-20@3:13:20//db_server0'
Command is: /usr/bin/scp farm12.csail.mit.edu:/tmp/web_server0 /home/drkp/sandbox/txcache/src/RUBiS-1.4.3/bench/2009-3-20@3:13:20//web_server0.bin
Command is: /usr/bin/ssh -x localhost /bin/bash -c 'LANG=en_GB.UTF-8 /usr/bin/sar -n DEV -n SOCK -rubcw 1 605 -f /home/drkp/sandbox/txcache/src/RUBiS-1.4.3/bench/2009-3-20@3:13:20//web_server0.bin > /home/drkp/sandbox/txcache/src/RUBiS-1.4.3/bench/2009-3-20@3:13:20//web_server0'
Command is: /usr/bin/scp farm13.csail.mit.edu:/tmp/web_server1 /home/drkp/sandbox/txcache/src/RUBiS-1.4.3/bench/2009-3-20@3:13:20//web_server1.bin
Command is: /usr/bin/ssh -x localhost /bin/bash -c 'LANG=en_GB.UTF-8 /usr/bin/sar -n DEV -n SOCK -rubcw 1 605 -f /home/drkp/sandbox/txcache/src/RUBiS-1.4.3/bench/2009-3-20@3:13:20//web_server1.bin > /home/drkp/sandbox/txcache/src/RUBiS-1.4.3/bench/2009-3-20@3:13:20//web_server1'
Command is: /usr/bin/scp localhost:/tmp/client0 /home/drkp/sandbox/txcache/src/RUBiS-1.4.3/bench/2009-3-20@3:13:20//client0.bin
Command is: /usr/bin/ssh -x localhost /bin/bash -c 'LANG=en_GB.UTF-8 /usr/bin/sar -n DEV -n SOCK -rubcw 1 605 -f /home/drkp/sandbox/txcache/src/RUBiS-1.4.3/bench/2009-3-20@3:13:20//client0.bin > /home/drkp/sandbox/txcache/src/RUBiS-1.4.3/bench/2009-3-20@3:13:20//client0'
Command is: /usr/bin/scp farm6.csail.mit.edu:/tmp/trace_client1.html /home/drkp/sandbox/txcache/src/RUBiS-1.4.3/bench/2009-3-20@3:13:20//
Command is: /usr/bin/scp farm6.csail.mit.edu:/tmp/stat_client1.html /home/drkp/sandbox/txcache/src/RUBiS-1.4.3/bench/2009-3-20@3:13:20//
|
|
|
|
|
|
 | 
|
 | 
|
 | 
|
 | 
|
 | 
|
 | 
|
 | 
|
 | 
|
 | 
|