Node information
Test timing information
Up ramp statistics
Runtime session statistics
Down ramp statistics
Overall statistics
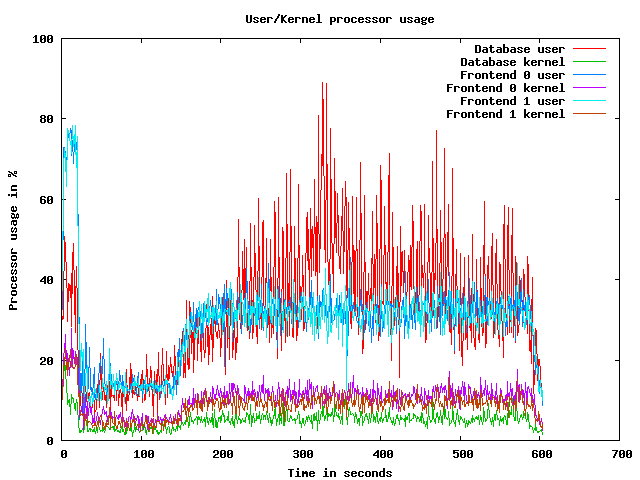
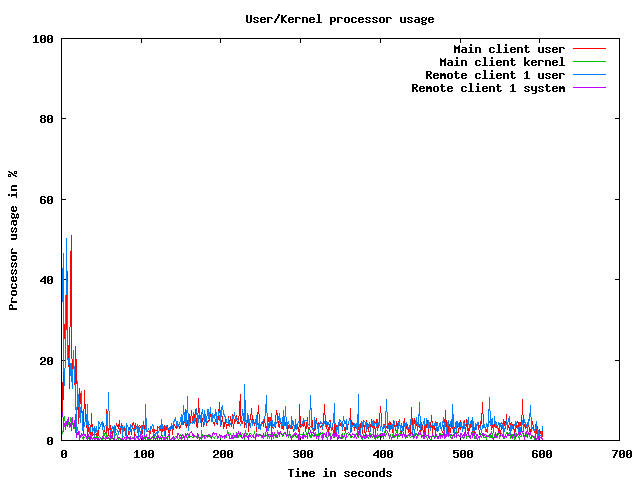
CPU usage graphs
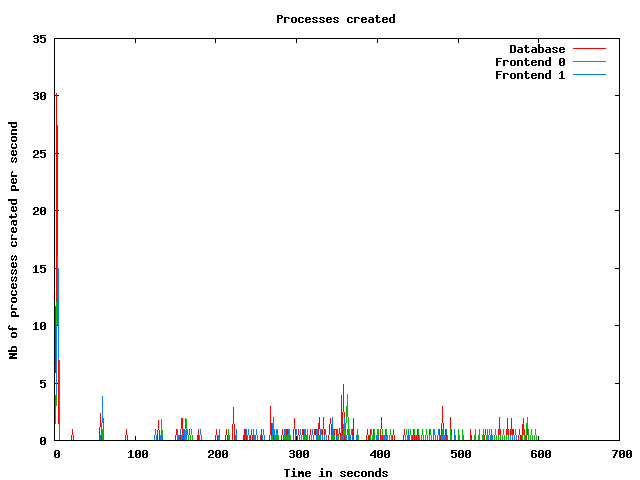
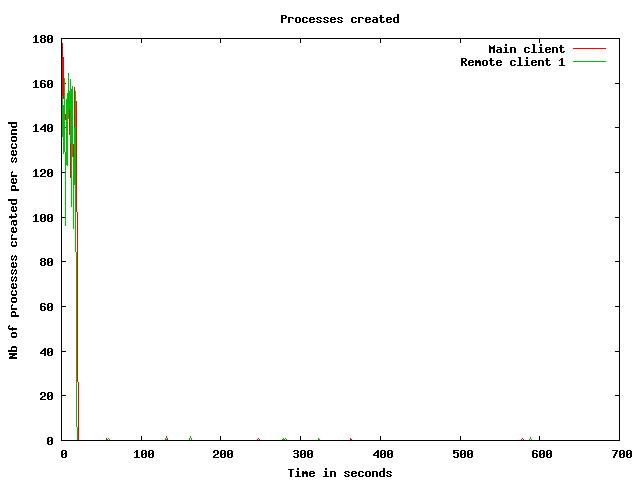
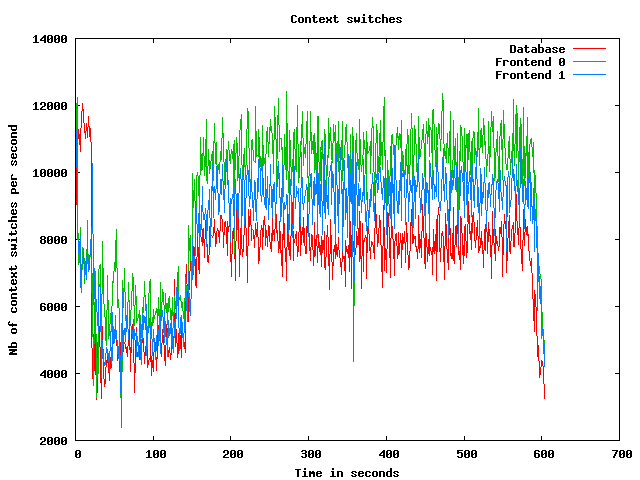
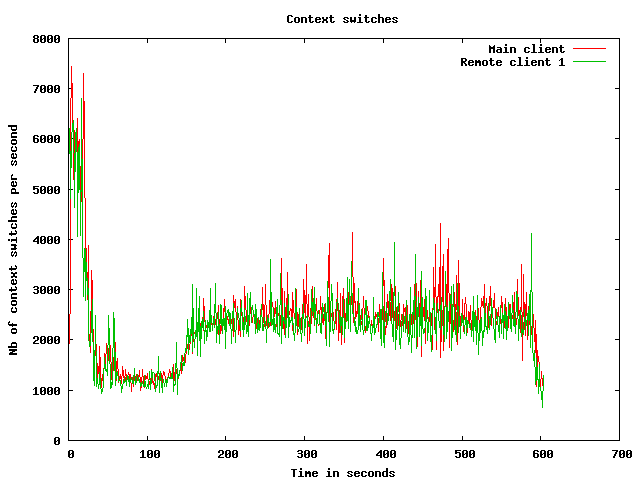
Processes usage graphs
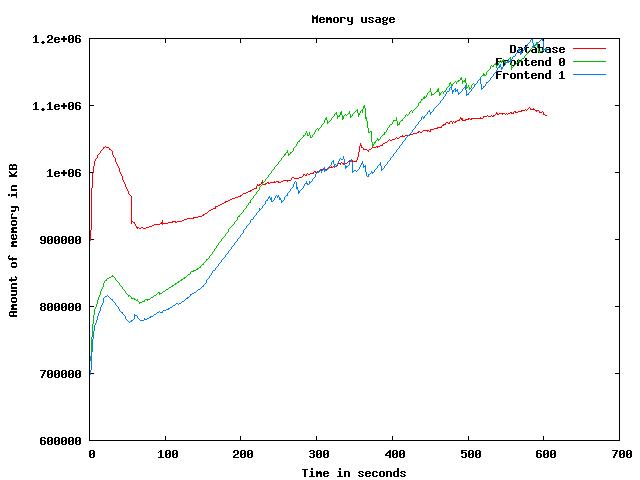
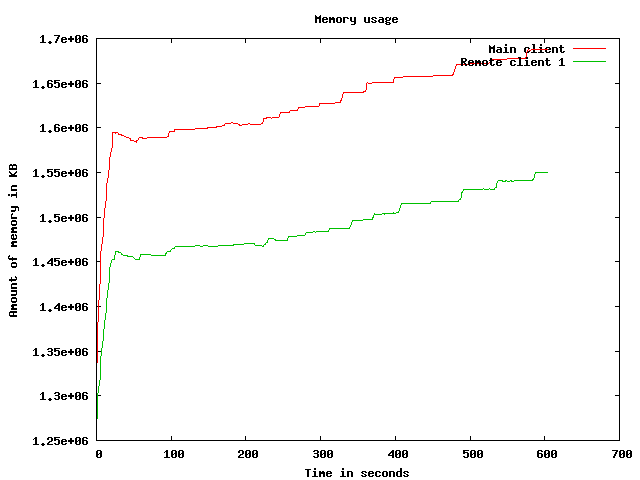
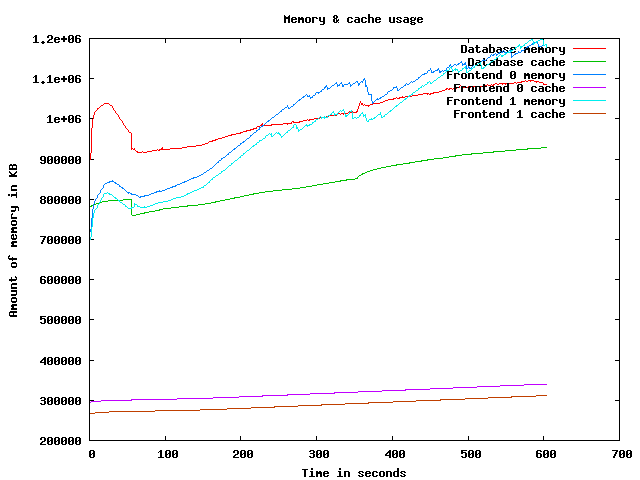
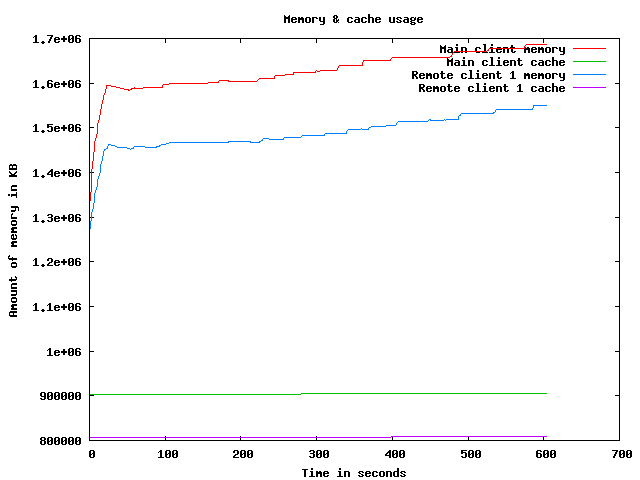
Memory usage graph
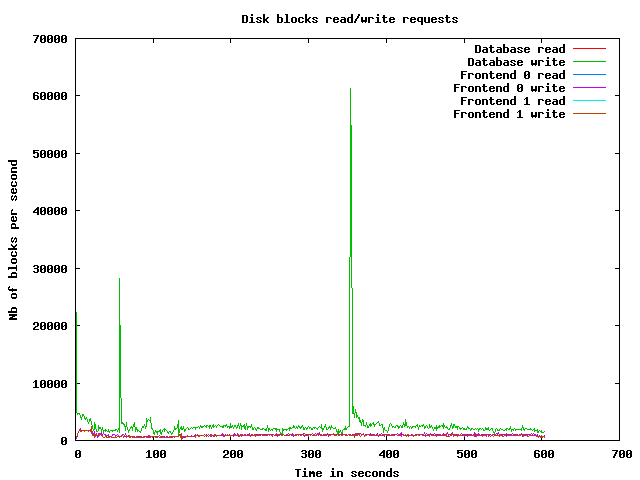
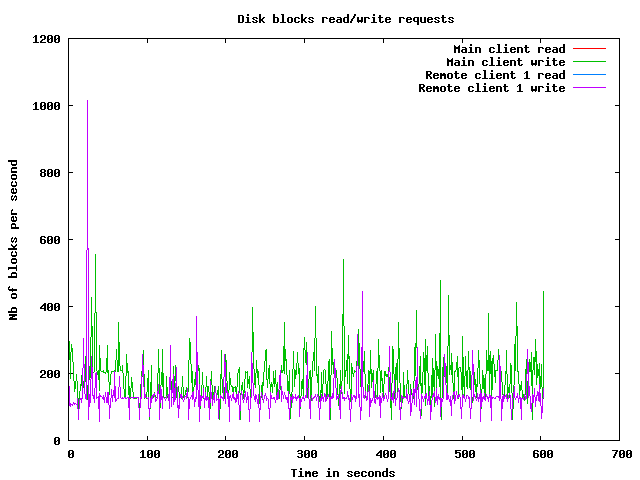
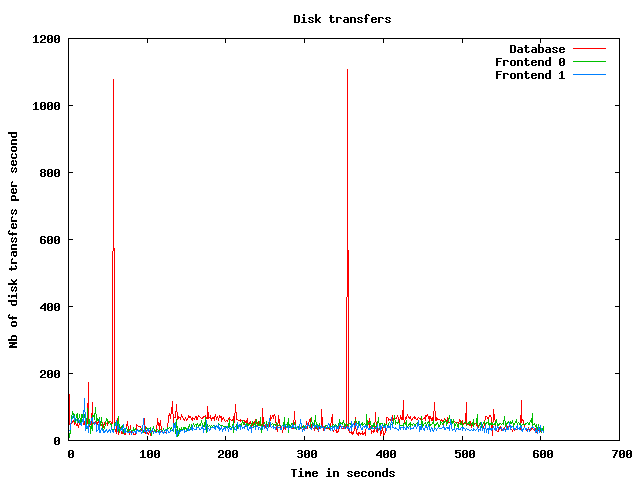
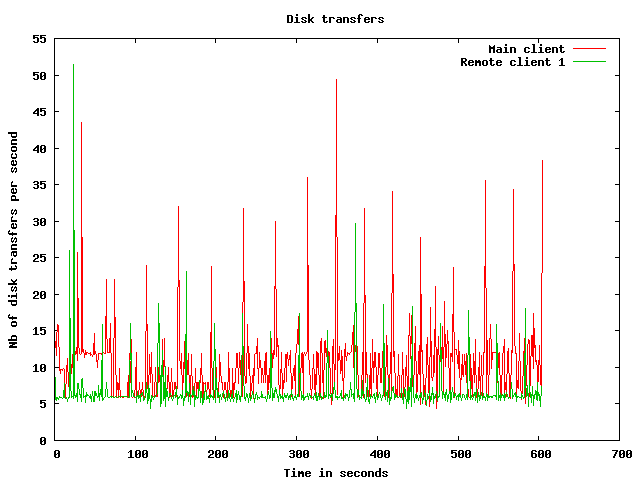
Disk usage graphs
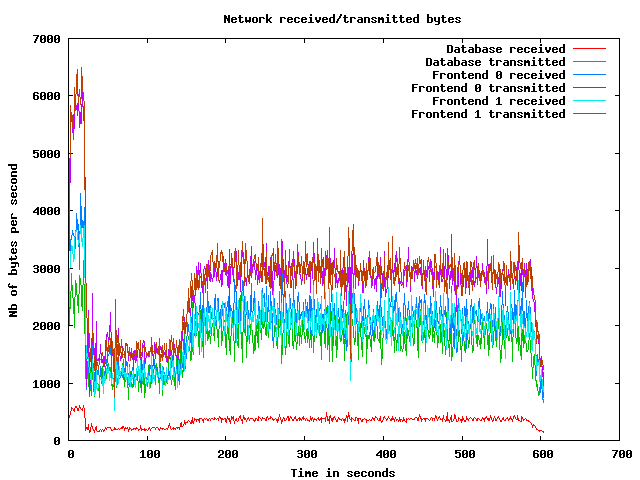
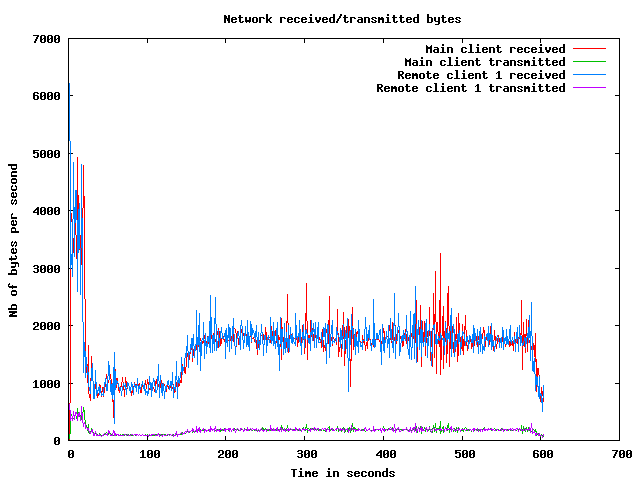
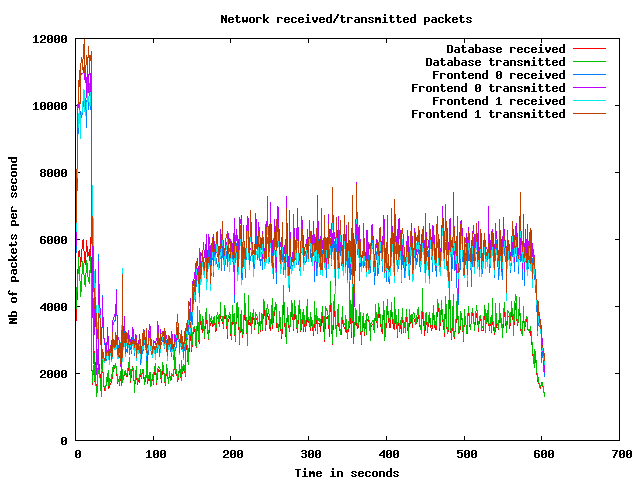
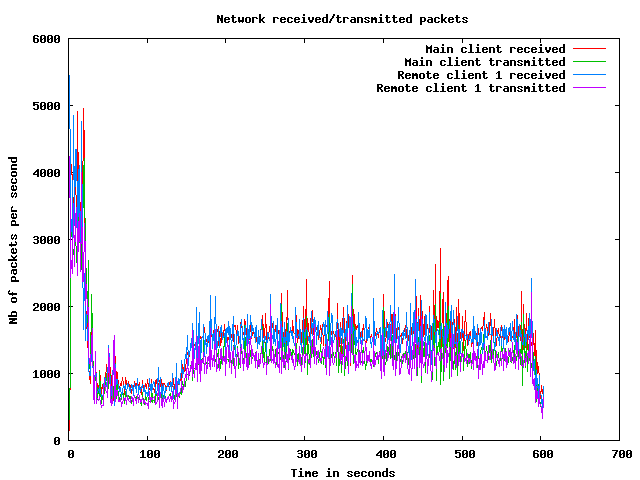
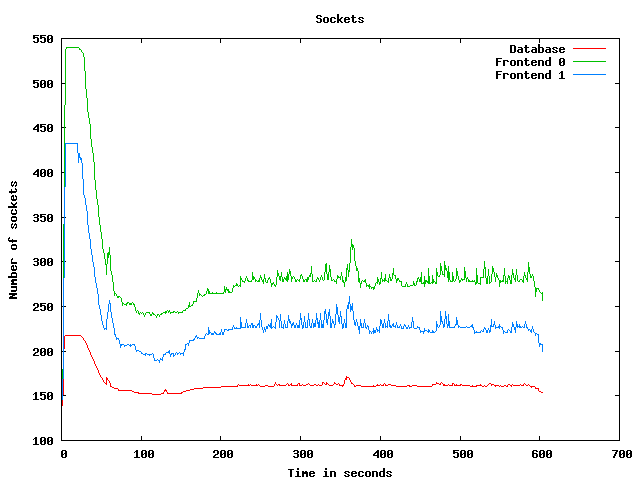
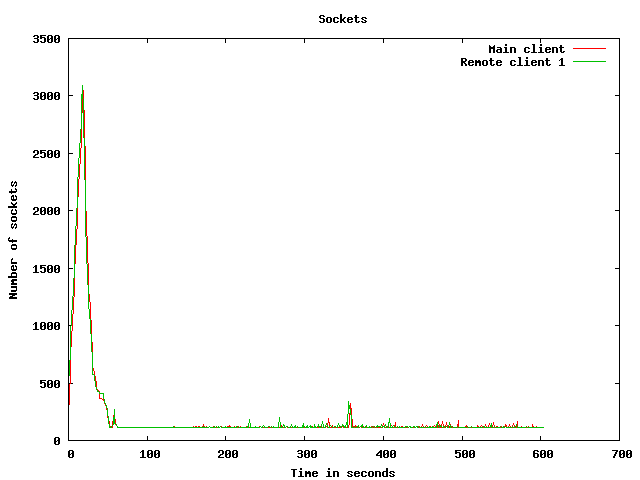
Network usage graphs
| Test start | 2009-3-20 2:20:16 |
| Up ramp start | 2009-3-20 2:20:38 |
| Runtime session start | 2009-3-20 2:22:38 |
| Down ramp start | 2009-3-20 2:30:8 |
| Test end | 2009-3-20 2:32:23 |
| Up ramp length | 2 minutes 1 millisecond (requested 120000 ms) |
| Runtime session length | 7 minutes 30 seconds 0 millisecond (requested 450000 ms) |
| Down ramp length | 30 seconds 3 milliseconds (requested 30000 ms) |
| Total test length | 12 minutes 6 seconds 461 milliseconds |
| State name | % of total | Count | Errors | Minimum Time | Maximum Time | Average Time |
|---|---|---|---|---|---|---|
Home | 9 % | 4928 | 0 | 0 ms | 56103 ms | 3491 ms
|
Register | 1 % | 680 | 0 | 0 ms | 44994 ms | 713 ms
|
RegisterUser | 1 % | 645 | 0 | 5 ms | 45015 ms | 1079 ms
|
Browse | 9 % | 5032 | 0 | 0 ms | 45005 ms | 1126 ms
|
BrowseCategories | 6 % | 3338 | 0 | 3 ms | 45012 ms | 982 ms
|
SearchItemsInCategory | 15 % | 7949 | 0 | 0 ms | 45063 ms | 890 ms
|
BrowseRegions | 2 % | 1383 | 0 | 3 ms | 45042 ms | 932 ms
|
BrowseCategoriesInRegion | 2 % | 1264 | 0 | 3 ms | 45014 ms | 775 ms
|
SearchItemsInRegion | 4 % | 2486 | 0 | 0 ms | 45088 ms | 926 ms
|
ViewItem | 12 % | 6610 | 0 | 3 ms | 45043 ms | 750 ms
|
ViewUserInfo | 2 % | 1268 | 0 | 3 ms | 45007 ms | 554 ms
|
ViewBidHistory | 1 % | 579 | 0 | 3 ms | 45040 ms | 487 ms
|
BuyNowAuth | 1 % | 554 | 0 | 2 ms | 45002 ms | 583 ms
|
BuyNow | 0 % | 497 | 76 | 5 ms | 21013 ms | 223 ms
|
StoreBuyBow | 0 % | 361 | 0 | 5 ms | 45019 ms | 695 ms
|
PutBidAuth | 4 % | 2222 | 0 | 0 ms | 45010 ms | 654 ms
|
PutBid | 4 % | 2205 | 288 | 0 ms | 45019 ms | 699 ms
|
StoreBid | 2 % | 1310 | 0 | 4 ms | 45019 ms | 766 ms
|
PutCommentAuth | 0 % | 0 | 0 | 0 ms | 0 ms | 0 ms
|
PutComment | 0 % | 189 | 25 | 4 ms | 21638 ms | 450 ms
|
StoreComment | 0 % | 144 | 0 | 5 ms | 9801 ms | 394 ms
|
Sell | 0 % | 408 | 0 | 0 ms | 44996 ms | 1252 ms
|
SelectCategoryToSellItem | 0 % | 379 | 0 | 4 ms | 24028 ms | 738 ms
|
SellItemForm | 0 % | 350 | 0 | 2 ms | 45003 ms | 929 ms
|
RegisterItem | 0 % | 326 | 0 | 4 ms | 45012 ms | 944 ms
|
AboutMe (auth form) | 2 % | 1137 | 0 | 0 ms | 45042 ms | 1239 ms
|
AboutMe | 3 % | 1597 | 0 | 4 ms | 45063 ms | 1049 ms
|
Back probability | 7 % | 4206 | 0 | 0 ms | 0 ms | 0 ms
|
End of Session | 1 % | 546 | 0 | 0 ms | 0 ms | 0 ms
|
Total | 100 % | 52593 | 389 | - | - | 1024 ms
|
Average throughput | 441 req/s
| |||||
Completed sessions | 496
| |||||
Total time | 24455 seconds
| |||||
Average session time | 49 seconds
| |||||
| State name | % of total | Count | Errors | Minimum Time | Maximum Time | Average Time |
|---|---|---|---|---|---|---|
Home | 4 % | 10090 | 0 | 0 ms | 3019 ms | 3 ms
|
Register | 1 % | 2390 | 0 | 0 ms | 2998 ms | 5 ms
|
RegisterUser | 1 % | 2319 | 11 | 5 ms | 943 ms | 19 ms
|
Browse | 7 % | 15887 | 0 | 0 ms | 3091 ms | 6 ms
|
BrowseCategories | 5 % | 11140 | 0 | 3 ms | 3039 ms | 14 ms
|
SearchItemsInCategory | 15 % | 34522 | 0 | 0 ms | 3118 ms | 20 ms
|
BrowseRegions | 2 % | 4531 | 0 | 3 ms | 3140 ms | 16 ms
|
BrowseCategoriesInRegion | 2 % | 4473 | 0 | 3 ms | 3030 ms | 15 ms
|
SearchItemsInRegion | 4 % | 11043 | 0 | 0 ms | 3200 ms | 37 ms
|
ViewItem | 14 % | 31332 | 0 | 3 ms | 3122 ms | 23 ms
|
ViewUserInfo | 3 % | 7164 | 0 | 3 ms | 3036 ms | 17 ms
|
ViewBidHistory | 1 % | 3953 | 0 | 3 ms | 3030 ms | 42 ms
|
BuyNowAuth | 1 % | 2870 | 0 | 2 ms | 3021 ms | 10 ms
|
BuyNow | 1 % | 2817 | 429 | 4 ms | 3041 ms | 21 ms
|
StoreBuyBow | 1 % | 2361 | 0 | 4 ms | 3004 ms | 17 ms
|
PutBidAuth | 4 % | 11008 | 0 | 0 ms | 3065 ms | 10 ms
|
PutBid | 5 % | 12710 | 1534 | 3 ms | 3232 ms | 23 ms
|
StoreBid | 3 % | 8161 | 1 | 4 ms | 3151 ms | 21 ms
|
PutCommentAuth | 0 % | 0 | 0 | 0 ms | 0 ms | 0 ms
|
PutComment | 0 % | 1048 | 80 | 3 ms | 703 ms | 19 ms
|
StoreComment | 0 % | 945 | 0 | 4 ms | 891 ms | 17 ms
|
Sell | 0 % | 1274 | 0 | 0 ms | 3019 ms | 9 ms
|
SelectCategoryToSellItem | 0 % | 1257 | 0 | 4 ms | 3061 ms | 18 ms
|
SellItemForm | 0 % | 1237 | 0 | 2 ms | 3057 ms | 15 ms
|
RegisterItem | 0 % | 1217 | 0 | 4 ms | 1178 ms | 17 ms
|
AboutMe (auth form) | 1 % | 3606 | 0 | 0 ms | 3063 ms | 8 ms
|
AboutMe | 2 % | 6152 | 0 | 4 ms | 3212 ms | 49 ms
|
Back probability | 10 % | 23000 | 0 | 0 ms | 0 ms | 0 ms
|
End of Session | 1 % | 3142 | 0 | 0 ms | 0 ms | 0 ms
|
Total | 100 % | 221649 | 2055 | - | - | 16 ms
|
Average throughput | 497 req/s
| |||||
Completed sessions | 3144
| |||||
Total time | 791519 seconds
| |||||
Average session time | 251 seconds
| |||||
| State name | % of total | Count | Errors | Minimum Time | Maximum Time | Average Time |
|---|---|---|---|---|---|---|
Home | 4 % | 302 | 0 | 0 ms | 27 ms | 0 ms
|
Register | 0 % | 61 | 0 | 0 ms | 19 ms | 1 ms
|
RegisterUser | 1 % | 88 | 2 | 5 ms | 228 ms | 12 ms
|
Browse | 7 % | 511 | 0 | 0 ms | 100 ms | 1 ms
|
BrowseCategories | 5 % | 394 | 0 | 3 ms | 98 ms | 7 ms
|
SearchItemsInCategory | 16 % | 1184 | 0 | 0 ms | 402 ms | 14 ms
|
BrowseRegions | 1 % | 134 | 0 | 3 ms | 19 ms | 6 ms
|
BrowseCategoriesInRegion | 1 % | 144 | 0 | 3 ms | 48 ms | 6 ms
|
SearchItemsInRegion | 4 % | 340 | 0 | 0 ms | 313 ms | 24 ms
|
ViewItem | 14 % | 1080 | 0 | 3 ms | 284 ms | 14 ms
|
ViewUserInfo | 2 % | 214 | 0 | 3 ms | 183 ms | 12 ms
|
ViewBidHistory | 1 % | 110 | 0 | 4 ms | 346 ms | 31 ms
|
BuyNowAuth | 1 % | 105 | 0 | 2 ms | 16 ms | 4 ms
|
BuyNow | 1 % | 108 | 13 | 5 ms | 26 ms | 10 ms
|
StoreBuyBow | 1 % | 88 | 0 | 4 ms | 58 ms | 10 ms
|
PutBidAuth | 5 % | 381 | 0 | 0 ms | 255 ms | 4 ms
|
PutBid | 5 % | 390 | 47 | 4 ms | 265 ms | 14 ms
|
StoreBid | 3 % | 247 | 0 | 4 ms | 51 ms | 11 ms
|
PutCommentAuth | 0 % | 0 | 0 | 0 ms | 0 ms | 0 ms
|
PutComment | 0 % | 39 | 3 | 5 ms | 130 ms | 17 ms
|
StoreComment | 0 % | 41 | 0 | 5 ms | 67 ms | 9 ms
|
Sell | 0 % | 44 | 0 | 0 ms | 5 ms | 0 ms
|
SelectCategoryToSellItem | 0 % | 40 | 0 | 4 ms | 31 ms | 8 ms
|
SellItemForm | 0 % | 40 | 0 | 2 ms | 15 ms | 3 ms
|
RegisterItem | 0 % | 31 | 0 | 4 ms | 53 ms | 12 ms
|
AboutMe (auth form) | 1 % | 114 | 0 | 0 ms | 143 ms | 2 ms
|
AboutMe | 2 % | 205 | 0 | 9 ms | 198 ms | 32 ms
|
Back probability | 10 % | 727 | 0 | 0 ms | 0 ms | 0 ms
|
End of Session | 1 % | 96 | 0 | 0 ms | 0 ms | 0 ms
|
Total | 100 % | 7258 | 65 | - | - | 10 ms
|
Average throughput | 244 req/s
| |||||
Completed sessions | 91
| |||||
Total time | 28828 seconds
| |||||
Average session time | 316 seconds
| |||||
| State name | % of total | Count | Errors | Minimum Time | Maximum Time | Average Time |
|---|---|---|---|---|---|---|
Home | 5 % | 15320 | 0 | 0 ms | 56103 ms | 1125 ms
|
Register | 1 % | 3131 | 0 | 0 ms | 44994 ms | 158 ms
|
RegisterUser | 1 % | 3052 | 13 | 5 ms | 45015 ms | 243 ms
|
Browse | 7 % | 21430 | 0 | 0 ms | 45005 ms | 269 ms
|
BrowseCategories | 5 % | 14872 | 0 | 3 ms | 45012 ms | 231 ms
|
SearchItemsInCategory | 15 % | 43807 | 0 | 0 ms | 45063 ms | 177 ms
|
BrowseRegions | 2 % | 6048 | 0 | 3 ms | 45042 ms | 225 ms
|
BrowseCategoriesInRegion | 2 % | 5881 | 0 | 3 ms | 45014 ms | 178 ms
|
SearchItemsInRegion | 4 % | 13901 | 0 | 0 ms | 45088 ms | 195 ms
|
ViewItem | 13 % | 39087 | 0 | 3 ms | 45043 ms | 145 ms
|
ViewUserInfo | 3 % | 8670 | 0 | 3 ms | 45007 ms | 96 ms
|
ViewBidHistory | 1 % | 4651 | 0 | 3 ms | 45040 ms | 97 ms
|
BuyNowAuth | 1 % | 3529 | 0 | 2 ms | 45002 ms | 100 ms
|
BuyNow | 1 % | 3422 | 518 | 4 ms | 21013 ms | 50 ms
|
StoreBuyBow | 0 % | 2810 | 0 | 4 ms | 45019 ms | 104 ms
|
PutBidAuth | 4 % | 13611 | 0 | 0 ms | 45010 ms | 115 ms
|
PutBid | 5 % | 15338 | 1869 | 0 ms | 45019 ms | 120 ms
|
StoreBid | 3 % | 9718 | 1 | 4 ms | 45019 ms | 121 ms
|
PutCommentAuth | 0 % | 0 | 0 | 0 ms | 0 ms | 0 ms
|
PutComment | 0 % | 1276 | 108 | 3 ms | 21638 ms | 82 ms
|
StoreComment | 0 % | 1130 | 0 | 4 ms | 9801 ms | 64 ms
|
Sell | 0 % | 1726 | 0 | 0 ms | 44996 ms | 303 ms
|
SelectCategoryToSellItem | 0 % | 1676 | 0 | 4 ms | 24028 ms | 180 ms
|
SellItemForm | 0 % | 1627 | 0 | 2 ms | 45003 ms | 211 ms
|
RegisterItem | 0 % | 1574 | 0 | 4 ms | 45012 ms | 209 ms
|
AboutMe (auth form) | 1 % | 4857 | 0 | 0 ms | 45042 ms | 296 ms
|
AboutMe | 2 % | 7987 | 0 | 4 ms | 45063 ms | 248 ms
|
Back probability | 9 % | 27933 | 0 | 0 ms | 0 ms | 0 ms
|
End of Session | 1 % | 3784 | 0 | 0 ms | 0 ms | 0 ms
|
Total | 100 % | 281848 | 2509 | - | - | 204 ms
|
Average throughput | 473 req/s
| |||||
Completed sessions | 3784
| |||||
Total time | 862700 seconds
| |||||
Average session time | 227 seconds
| |||||
An error occured while waiting for remote processes termination (Skipping waits)
Command is: /usr/bin/scp farm6.csail.mit.edu:/tmp/client1 /home/drkp/sandbox/txcache/src/RUBiS-1.4.3/bench/2009-3-20@2:20:16//client1.bin
Command is: /usr/bin/ssh -x localhost /bin/bash -c 'LANG=en_GB.UTF-8 /usr/bin/sar -n DEV -n SOCK -rubcw 1 605 -f /home/drkp/sandbox/txcache/src/RUBiS-1.4.3/bench/2009-3-20@2:20:16//client1.bin > /home/drkp/sandbox/txcache/src/RUBiS-1.4.3/bench/2009-3-20@2:20:16//client1'
Command is: /usr/bin/scp farm14:/tmp/db_server0 /home/drkp/sandbox/txcache/src/RUBiS-1.4.3/bench/2009-3-20@2:20:16//db_server0.bin
Command is: /usr/bin/ssh -x localhost /bin/bash -c 'LANG=en_GB.UTF-8 /usr/bin/sar -n DEV -n SOCK -rubcw 1 605 -f /home/drkp/sandbox/txcache/src/RUBiS-1.4.3/bench/2009-3-20@2:20:16//db_server0.bin > /home/drkp/sandbox/txcache/src/RUBiS-1.4.3/bench/2009-3-20@2:20:16//db_server0'
Command is: /usr/bin/scp farm12.csail.mit.edu:/tmp/web_server0 /home/drkp/sandbox/txcache/src/RUBiS-1.4.3/bench/2009-3-20@2:20:16//web_server0.bin
Command is: /usr/bin/ssh -x localhost /bin/bash -c 'LANG=en_GB.UTF-8 /usr/bin/sar -n DEV -n SOCK -rubcw 1 605 -f /home/drkp/sandbox/txcache/src/RUBiS-1.4.3/bench/2009-3-20@2:20:16//web_server0.bin > /home/drkp/sandbox/txcache/src/RUBiS-1.4.3/bench/2009-3-20@2:20:16//web_server0'
Command is: /usr/bin/scp farm13.csail.mit.edu:/tmp/web_server1 /home/drkp/sandbox/txcache/src/RUBiS-1.4.3/bench/2009-3-20@2:20:16//web_server1.bin
Command is: /usr/bin/ssh -x localhost /bin/bash -c 'LANG=en_GB.UTF-8 /usr/bin/sar -n DEV -n SOCK -rubcw 1 605 -f /home/drkp/sandbox/txcache/src/RUBiS-1.4.3/bench/2009-3-20@2:20:16//web_server1.bin > /home/drkp/sandbox/txcache/src/RUBiS-1.4.3/bench/2009-3-20@2:20:16//web_server1'
Command is: /usr/bin/scp localhost:/tmp/client0 /home/drkp/sandbox/txcache/src/RUBiS-1.4.3/bench/2009-3-20@2:20:16//client0.bin
Command is: /usr/bin/ssh -x localhost /bin/bash -c 'LANG=en_GB.UTF-8 /usr/bin/sar -n DEV -n SOCK -rubcw 1 605 -f /home/drkp/sandbox/txcache/src/RUBiS-1.4.3/bench/2009-3-20@2:20:16//client0.bin > /home/drkp/sandbox/txcache/src/RUBiS-1.4.3/bench/2009-3-20@2:20:16//client0'
Command is: /usr/bin/scp farm6.csail.mit.edu:/tmp/trace_client1.html /home/drkp/sandbox/txcache/src/RUBiS-1.4.3/bench/2009-3-20@2:20:16//
Command is: /usr/bin/scp farm6.csail.mit.edu:/tmp/stat_client1.html /home/drkp/sandbox/txcache/src/RUBiS-1.4.3/bench/2009-3-20@2:20:16//
|
|
|
|
|
|
 | 
|
 | 
|
 | 
|
 | 
|
 | 
|
 | 
|
 | 
|
 | 
|
 | 
|