Node information
Test timing information
Up ramp statistics
Runtime session statistics
Down ramp statistics
Overall statistics
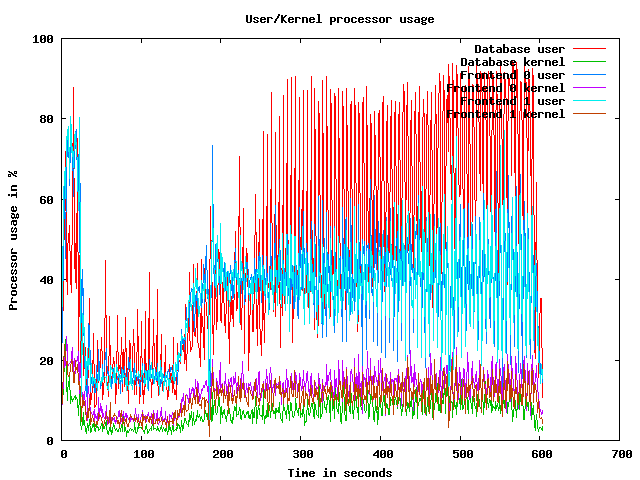
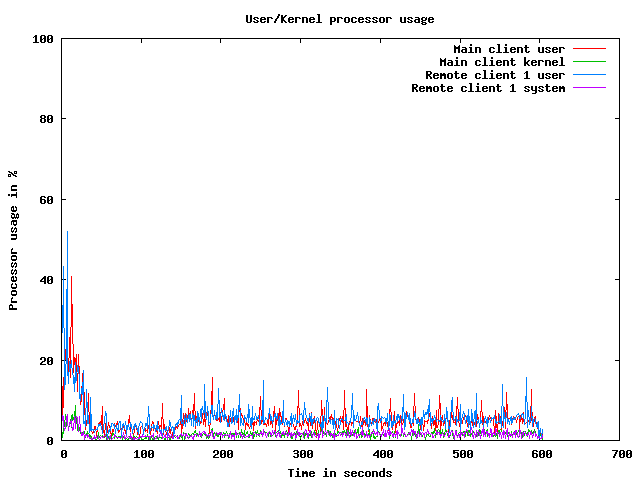
CPU usage graphs
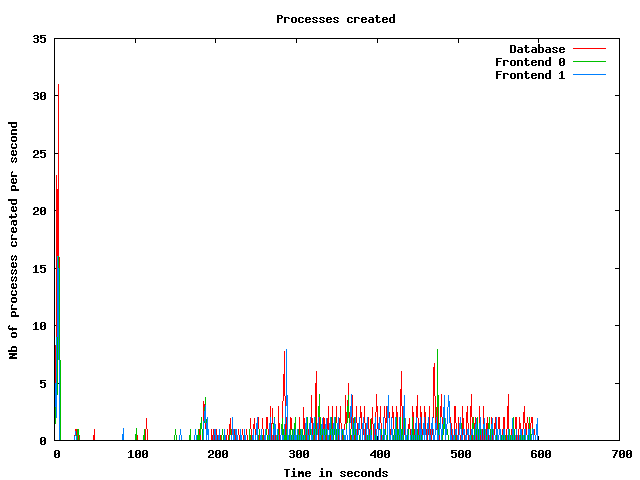
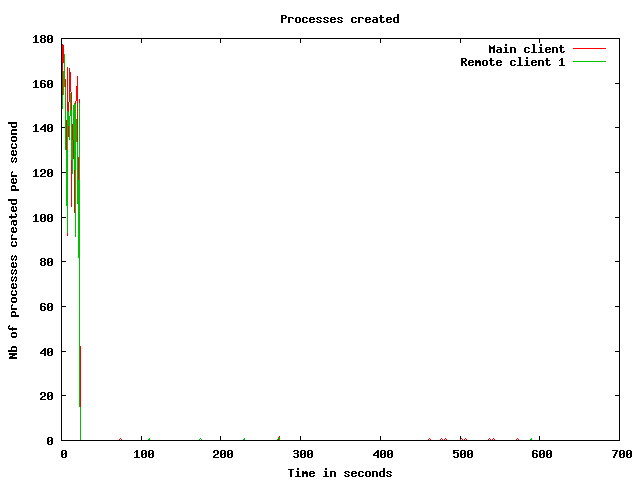
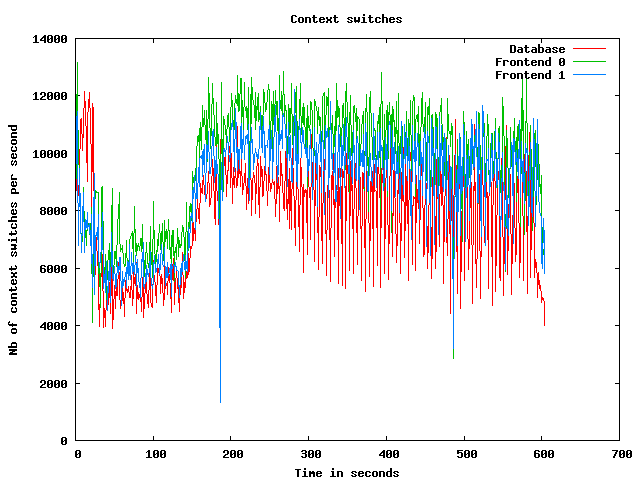
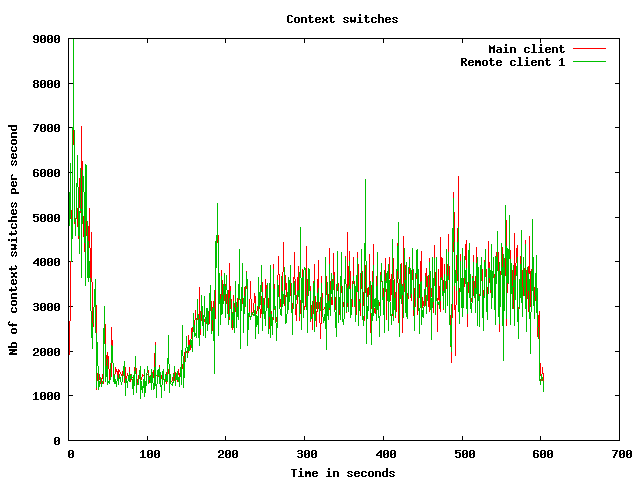
Processes usage graphs
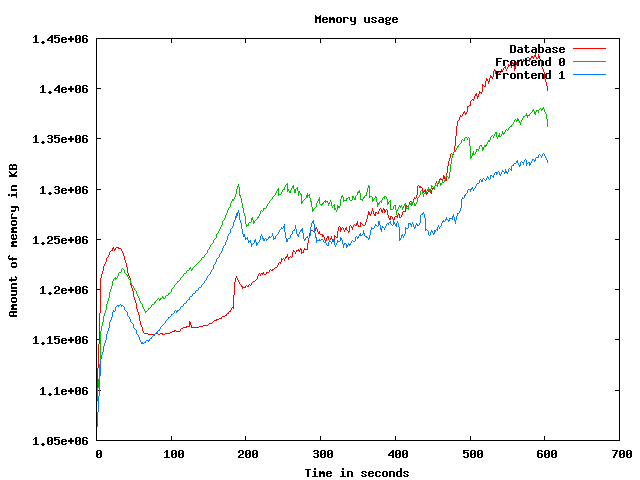
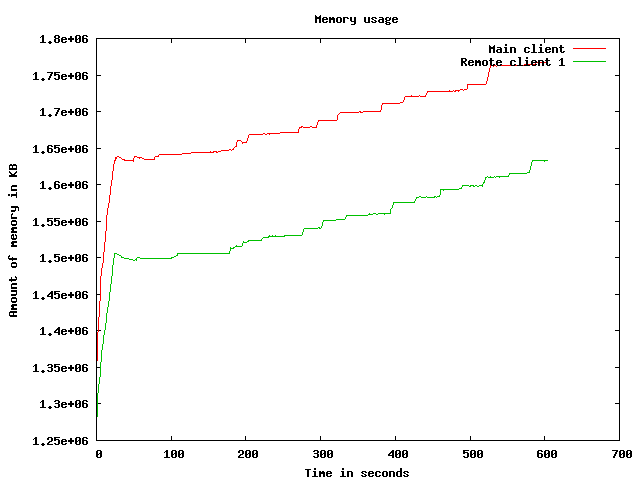
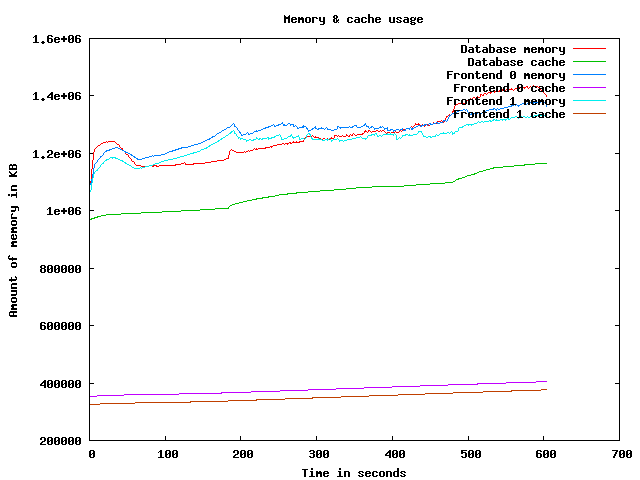
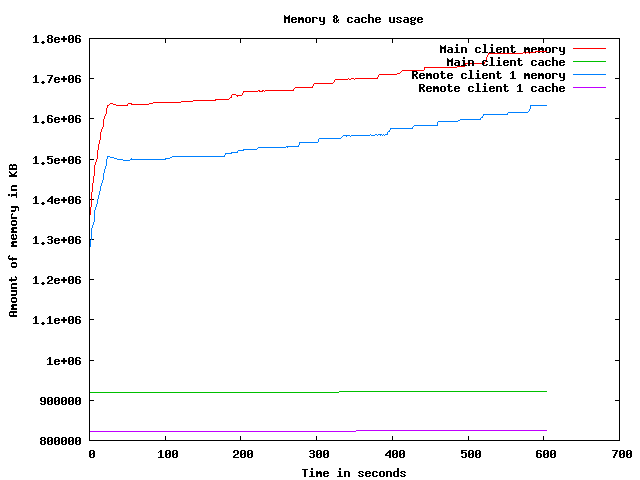
Memory usage graph
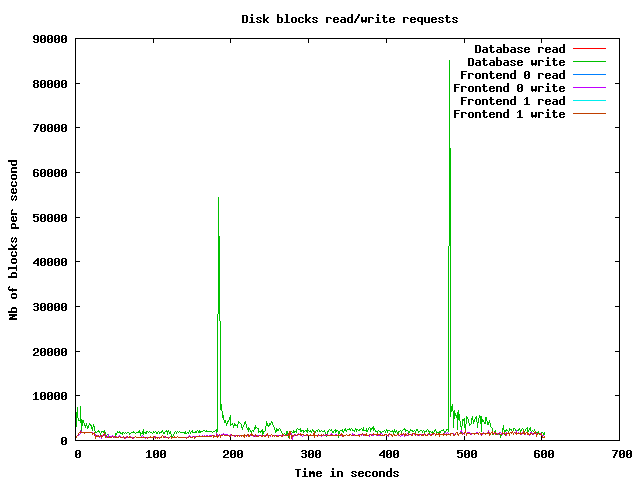
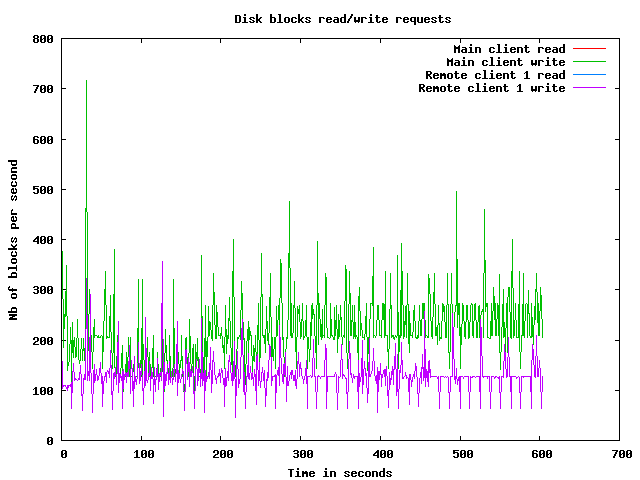
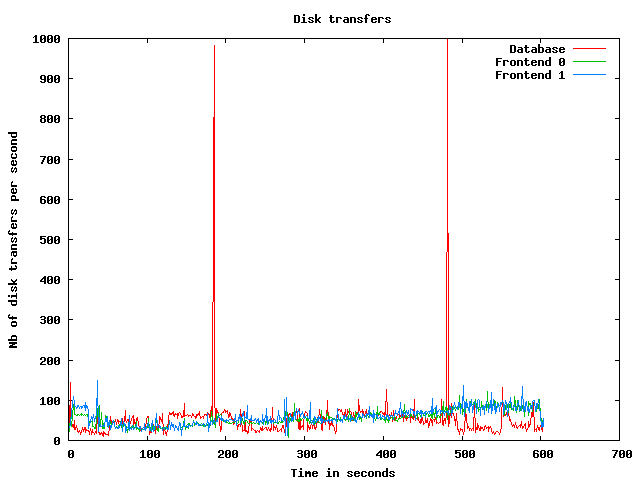
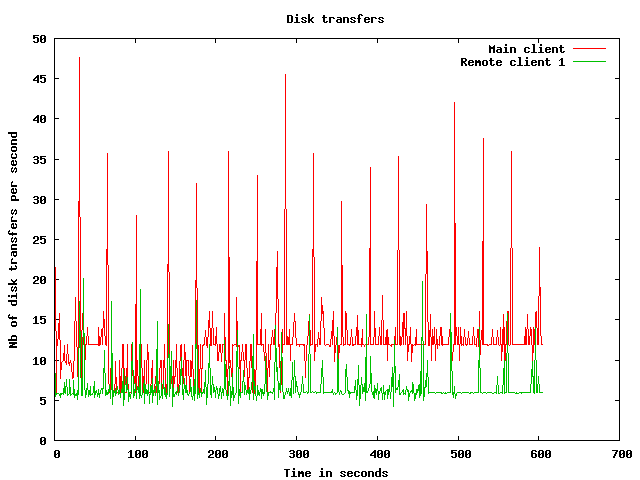
Disk usage graphs
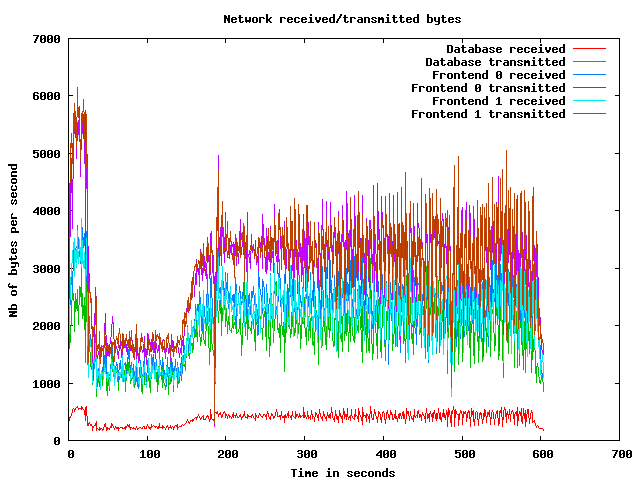
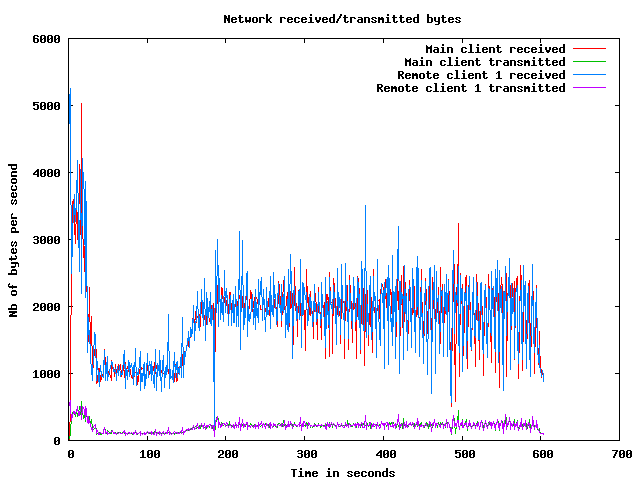
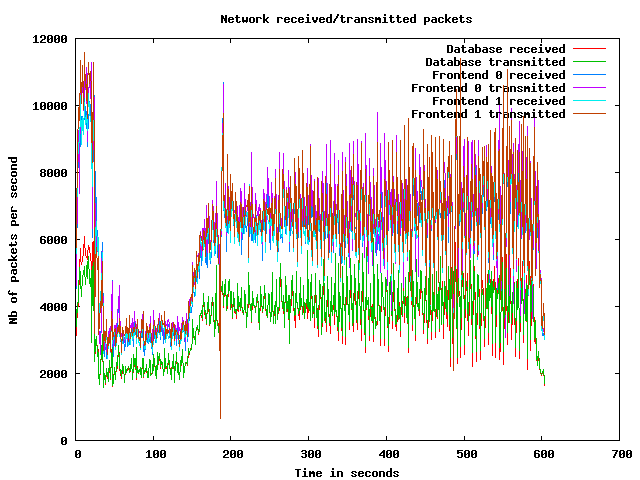
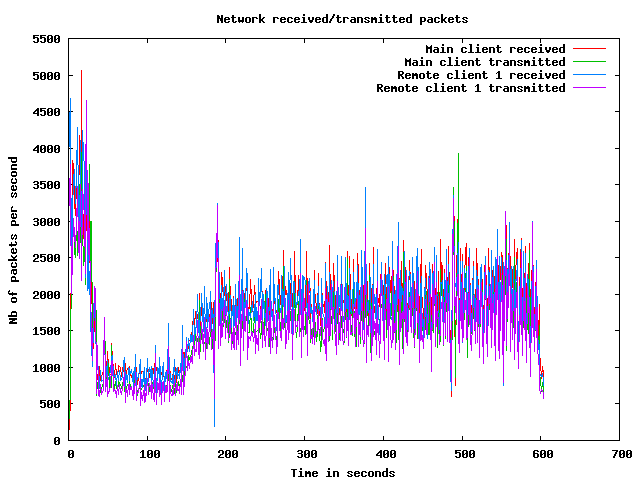
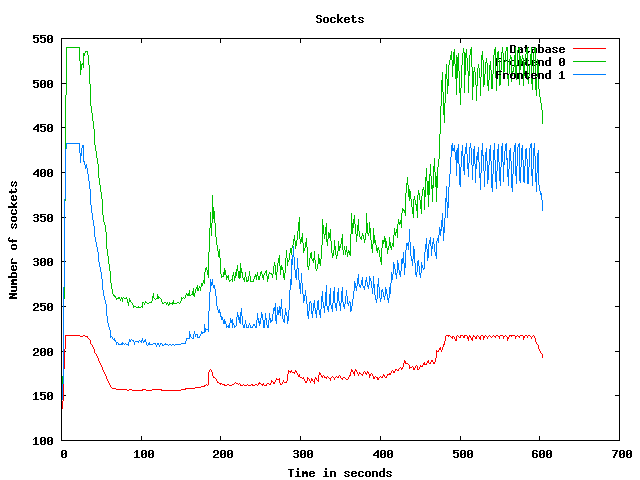
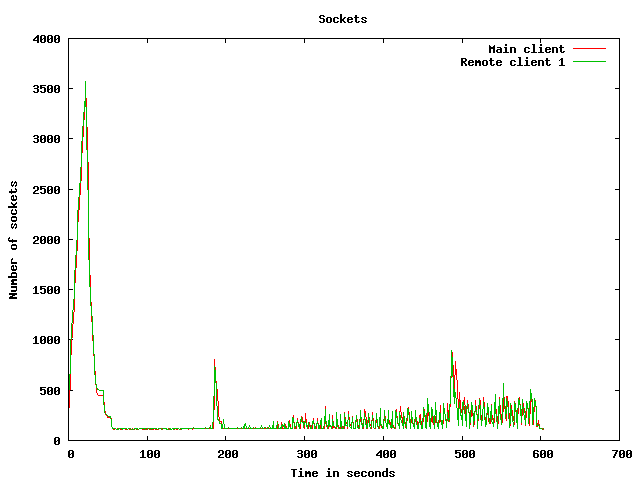
Network usage graphs
| Test start | 2009-3-20 2:33:9 |
| Up ramp start | 2009-3-20 2:33:34 |
| Runtime session start | 2009-3-20 2:35:34 |
| Down ramp start | 2009-3-20 2:43:4 |
| Test end | 2009-3-20 2:45:31 |
| Up ramp length | 2 minutes 0 millisecond (requested 120000 ms) |
| Runtime session length | 7 minutes 30 seconds 0 millisecond (requested 450000 ms) |
| Down ramp length | 30 seconds 1 millisecond (requested 30000 ms) |
| Total test length | 12 minutes 21 seconds 860 milliseconds |
| State name | % of total | Count | Errors | Minimum Time | Maximum Time | Average Time |
|---|---|---|---|---|---|---|
Home | 9 % | 5732 | 0 | 0 ms | 45041 ms | 3953 ms
|
Register | 1 % | 819 | 0 | 0 ms | 45001 ms | 1289 ms
|
RegisterUser | 1 % | 779 | 10 | 5 ms | 45005 ms | 1041 ms
|
Browse | 9 % | 5698 | 0 | 0 ms | 45028 ms | 1500 ms
|
BrowseCategories | 6 % | 3761 | 0 | 3 ms | 45010 ms | 1085 ms
|
SearchItemsInCategory | 14 % | 8698 | 0 | 0 ms | 45078 ms | 761 ms
|
BrowseRegions | 2 % | 1566 | 0 | 3 ms | 45018 ms | 786 ms
|
BrowseCategoriesInRegion | 2 % | 1449 | 0 | 3 ms | 45020 ms | 973 ms
|
SearchItemsInRegion | 4 % | 2913 | 0 | 0 ms | 45119 ms | 810 ms
|
ViewItem | 12 % | 7332 | 0 | 3 ms | 45042 ms | 721 ms
|
ViewUserInfo | 2 % | 1263 | 0 | 3 ms | 45009 ms | 518 ms
|
ViewBidHistory | 1 % | 685 | 0 | 4 ms | 23504 ms | 794 ms
|
BuyNowAuth | 1 % | 638 | 0 | 2 ms | 45008 ms | 757 ms
|
BuyNow | 0 % | 582 | 86 | 5 ms | 45015 ms | 801 ms
|
StoreBuyBow | 0 % | 433 | 0 | 4 ms | 21329 ms | 645 ms
|
PutBidAuth | 4 % | 2598 | 0 | 0 ms | 45003 ms | 611 ms
|
PutBid | 4 % | 2557 | 378 | 0 ms | 45033 ms | 542 ms
|
StoreBid | 2 % | 1460 | 0 | 4 ms | 45025 ms | 458 ms
|
PutCommentAuth | 0 % | 0 | 0 | 0 ms | 0 ms | 0 ms
|
PutComment | 0 % | 201 | 22 | 4 ms | 30989 ms | 1099 ms
|
StoreComment | 0 % | 161 | 0 | 4 ms | 45012 ms | 853 ms
|
Sell | 0 % | 421 | 0 | 0 ms | 44997 ms | 1077 ms
|
SelectCategoryToSellItem | 0 % | 393 | 0 | 4 ms | 45033 ms | 985 ms
|
SellItemForm | 0 % | 365 | 0 | 2 ms | 45005 ms | 997 ms
|
RegisterItem | 0 % | 341 | 0 | 4 ms | 23519 ms | 395 ms
|
AboutMe (auth form) | 2 % | 1299 | 0 | 0 ms | 45008 ms | 1255 ms
|
AboutMe | 3 % | 1813 | 0 | 5 ms | 45079 ms | 1187 ms
|
Back probability | 7 % | 4542 | 0 | 0 ms | 0 ms | 0 ms
|
End of Session | 1 % | 659 | 0 | 0 ms | 0 ms | 0 ms
|
Total | 100 % | 59158 | 496 | - | - | 1100 ms
|
Average throughput | 497 req/s
| |||||
Completed sessions | 590
| |||||
Total time | 32768 seconds
| |||||
Average session time | 55 seconds
| |||||
| State name | % of total | Count | Errors | Minimum Time | Maximum Time | Average Time |
|---|---|---|---|---|---|---|
Home | 4 % | 11499 | 0 | 0 ms | 10691 ms | 57 ms
|
Register | 1 % | 2607 | 0 | 0 ms | 21504 ms | 145 ms
|
RegisterUser | 1 % | 2559 | 34 | 5 ms | 93043 ms | 224 ms
|
Browse | 7 % | 18181 | 0 | 0 ms | 21716 ms | 146 ms
|
BrowseCategories | 5 % | 12718 | 0 | 3 ms | 22177 ms | 157 ms
|
SearchItemsInCategory | 15 % | 39546 | 0 | 0 ms | 93047 ms | 215 ms
|
BrowseRegions | 2 % | 5277 | 0 | 3 ms | 22263 ms | 164 ms
|
BrowseCategoriesInRegion | 2 % | 5180 | 0 | 3 ms | 21227 ms | 146 ms
|
SearchItemsInRegion | 5 % | 12804 | 0 | 0 ms | 93029 ms | 215 ms
|
ViewItem | 14 % | 36255 | 0 | 3 ms | 93094 ms | 189 ms
|
ViewUserInfo | 3 % | 8100 | 0 | 3 ms | 10708 ms | 172 ms
|
ViewBidHistory | 1 % | 4247 | 0 | 3 ms | 21611 ms | 220 ms
|
BuyNowAuth | 1 % | 3317 | 0 | 2 ms | 9460 ms | 149 ms
|
BuyNow | 1 % | 3264 | 472 | 4 ms | 9414 ms | 165 ms
|
StoreBuyBow | 1 % | 2740 | 0 | 4 ms | 22153 ms | 170 ms
|
PutBidAuth | 4 % | 12464 | 0 | 0 ms | 22311 ms | 146 ms
|
PutBid | 5 % | 14191 | 1713 | 4 ms | 93079 ms | 184 ms
|
StoreBid | 3 % | 9315 | 5 | 4 ms | 21398 ms | 170 ms
|
PutCommentAuth | 0 % | 0 | 0 | 0 ms | 0 ms | 0 ms
|
PutComment | 0 % | 1239 | 110 | 4 ms | 3592 ms | 172 ms
|
StoreComment | 0 % | 1100 | 0 | 4 ms | 9093 ms | 168 ms
|
Sell | 0 % | 1413 | 0 | 0 ms | 3862 ms | 129 ms
|
SelectCategoryToSellItem | 0 % | 1389 | 0 | 4 ms | 9010 ms | 169 ms
|
SellItemForm | 0 % | 1368 | 0 | 2 ms | 4565 ms | 144 ms
|
RegisterItem | 0 % | 1344 | 0 | 5 ms | 9455 ms | 155 ms
|
AboutMe (auth form) | 1 % | 4168 | 0 | 0 ms | 21520 ms | 160 ms
|
AboutMe | 2 % | 7085 | 0 | 4 ms | 21320 ms | 225 ms
|
Back probability | 10 % | 26204 | 0 | 0 ms | 0 ms | 0 ms
|
End of Session | 1 % | 3666 | 0 | 0 ms | 0 ms | 0 ms
|
Total | 100 % | 253240 | 2334 | - | - | 154 ms
|
Average throughput | 567 req/s
| |||||
Completed sessions | 3678
| |||||
Total time | 915079 seconds
| |||||
Average session time | 248 seconds
| |||||
| State name | % of total | Count | Errors | Minimum Time | Maximum Time | Average Time |
|---|---|---|---|---|---|---|
Home | 4 % | 411 | 0 | 0 ms | 3069 ms | 28 ms
|
Register | 1 % | 94 | 0 | 0 ms | 3053 ms | 100 ms
|
RegisterUser | 1 % | 86 | 0 | 5 ms | 3115 ms | 111 ms
|
Browse | 7 % | 626 | 0 | 0 ms | 3102 ms | 70 ms
|
BrowseCategories | 5 % | 439 | 0 | 3 ms | 3332 ms | 64 ms
|
SearchItemsInCategory | 14 % | 1258 | 0 | 1 ms | 4280 ms | 194 ms
|
BrowseRegions | 2 % | 186 | 0 | 3 ms | 3086 ms | 80 ms
|
BrowseCategoriesInRegion | 2 % | 179 | 0 | 3 ms | 3012 ms | 41 ms
|
SearchItemsInRegion | 4 % | 421 | 0 | 0 ms | 3279 ms | 167 ms
|
ViewItem | 14 % | 1207 | 0 | 3 ms | 3162 ms | 121 ms
|
ViewUserInfo | 3 % | 277 | 0 | 3 ms | 3116 ms | 148 ms
|
ViewBidHistory | 1 % | 143 | 0 | 3 ms | 3445 ms | 163 ms
|
BuyNowAuth | 1 % | 133 | 0 | 2 ms | 3066 ms | 55 ms
|
BuyNow | 1 % | 106 | 26 | 5 ms | 3034 ms | 161 ms
|
StoreBuyBow | 0 % | 84 | 0 | 5 ms | 3116 ms | 179 ms
|
PutBidAuth | 5 % | 430 | 0 | 0 ms | 3266 ms | 90 ms
|
PutBid | 5 % | 460 | 57 | 4 ms | 3129 ms | 98 ms
|
StoreBid | 3 % | 293 | 0 | 4 ms | 3095 ms | 94 ms
|
PutCommentAuth | 0 % | 0 | 0 | 0 ms | 0 ms | 0 ms
|
PutComment | 0 % | 35 | 4 | 5 ms | 3025 ms | 302 ms
|
StoreComment | 0 % | 38 | 0 | 4 ms | 3019 ms | 95 ms
|
Sell | 0 % | 54 | 0 | 0 ms | 2999 ms | 64 ms
|
SelectCategoryToSellItem | 0 % | 43 | 0 | 5 ms | 653 ms | 26 ms
|
SellItemForm | 0 % | 38 | 0 | 2 ms | 3042 ms | 83 ms
|
RegisterItem | 0 % | 36 | 0 | 4 ms | 3022 ms | 193 ms
|
AboutMe (auth form) | 1 % | 159 | 0 | 0 ms | 3105 ms | 108 ms
|
AboutMe | 2 % | 253 | 0 | 9 ms | 3340 ms | 172 ms
|
Back probability | 10 % | 903 | 0 | 0 ms | 0 ms | 0 ms
|
End of Session | 1 % | 119 | 0 | 0 ms | 0 ms | 0 ms
|
Total | 100 % | 8511 | 87 | - | - | 103 ms
|
Average throughput | 286 req/s
| |||||
Completed sessions | 123
| |||||
Total time | 41423 seconds
| |||||
Average session time | 336 seconds
| |||||
| State name | % of total | Count | Errors | Minimum Time | Maximum Time | Average Time |
|---|---|---|---|---|---|---|
Home | 5 % | 17642 | 0 | 0 ms | 45041 ms | 1322 ms
|
Register | 1 % | 3520 | 0 | 0 ms | 45001 ms | 410 ms
|
RegisterUser | 1 % | 3424 | 44 | 5 ms | 93043 ms | 407 ms
|
Browse | 7 % | 24505 | 0 | 0 ms | 45028 ms | 459 ms
|
BrowseCategories | 5 % | 16918 | 0 | 3 ms | 45010 ms | 361 ms
|
SearchItemsInCategory | 15 % | 49677 | 0 | 0 ms | 93047 ms | 309 ms
|
BrowseRegions | 2 % | 7029 | 0 | 3 ms | 45018 ms | 300 ms
|
BrowseCategoriesInRegion | 2 % | 6808 | 0 | 3 ms | 45020 ms | 319 ms
|
SearchItemsInRegion | 5 % | 16183 | 0 | 0 ms | 93029 ms | 321 ms
|
ViewItem | 13 % | 44890 | 0 | 3 ms | 93094 ms | 273 ms
|
ViewUserInfo | 3 % | 9666 | 0 | 3 ms | 45009 ms | 216 ms
|
ViewBidHistory | 1 % | 5088 | 0 | 3 ms | 23504 ms | 295 ms
|
BuyNowAuth | 1 % | 4088 | 0 | 2 ms | 45008 ms | 241 ms
|
BuyNow | 1 % | 3952 | 584 | 4 ms | 45015 ms | 258 ms
|
StoreBuyBow | 1 % | 3257 | 0 | 4 ms | 22153 ms | 233 ms
|
PutBidAuth | 4 % | 15492 | 0 | 0 ms | 45003 ms | 222 ms
|
PutBid | 5 % | 17254 | 2148 | 0 ms | 93079 ms | 234 ms
|
StoreBid | 3 % | 11068 | 5 | 4 ms | 45025 ms | 206 ms
|
PutCommentAuth | 0 % | 0 | 0 | 0 ms | 0 ms | 0 ms
|
PutComment | 0 % | 1475 | 136 | 4 ms | 30989 ms | 301 ms
|
StoreComment | 0 % | 1299 | 0 | 4 ms | 45012 ms | 251 ms
|
Sell | 0 % | 1888 | 0 | 0 ms | 44997 ms | 338 ms
|
SelectCategoryToSellItem | 0 % | 1825 | 0 | 4 ms | 45033 ms | 341 ms
|
SellItemForm | 0 % | 1771 | 0 | 2 ms | 45005 ms | 319 ms
|
RegisterItem | 0 % | 1721 | 0 | 4 ms | 23519 ms | 203 ms
|
AboutMe (auth form) | 1 % | 5626 | 0 | 0 ms | 45008 ms | 412 ms
|
AboutMe | 2 % | 9198 | 0 | 4 ms | 45079 ms | 412 ms
|
Back probability | 9 % | 31649 | 0 | 0 ms | 0 ms | 0 ms
|
End of Session | 1 % | 4444 | 0 | 0 ms | 0 ms | 0 ms
|
Total | 100 % | 321357 | 2917 | - | - | 326 ms
|
Average throughput | 540 req/s
| |||||
Completed sessions | 4444
| |||||
Total time | 1006873 seconds
| |||||
Average session time | 226 seconds
| |||||
An error occured while waiting for remote processes termination (Skipping waits)
Command is: /usr/bin/scp farm6.csail.mit.edu:/tmp/client1 /home/drkp/sandbox/txcache/src/RUBiS-1.4.3/bench/2009-3-20@2:33:9//client1.bin
Command is: /usr/bin/ssh -x localhost /bin/bash -c 'LANG=en_GB.UTF-8 /usr/bin/sar -n DEV -n SOCK -rubcw 1 605 -f /home/drkp/sandbox/txcache/src/RUBiS-1.4.3/bench/2009-3-20@2:33:9//client1.bin > /home/drkp/sandbox/txcache/src/RUBiS-1.4.3/bench/2009-3-20@2:33:9//client1'
Command is: /usr/bin/scp farm14:/tmp/db_server0 /home/drkp/sandbox/txcache/src/RUBiS-1.4.3/bench/2009-3-20@2:33:9//db_server0.bin
Command is: /usr/bin/ssh -x localhost /bin/bash -c 'LANG=en_GB.UTF-8 /usr/bin/sar -n DEV -n SOCK -rubcw 1 605 -f /home/drkp/sandbox/txcache/src/RUBiS-1.4.3/bench/2009-3-20@2:33:9//db_server0.bin > /home/drkp/sandbox/txcache/src/RUBiS-1.4.3/bench/2009-3-20@2:33:9//db_server0'
Command is: /usr/bin/scp farm12.csail.mit.edu:/tmp/web_server0 /home/drkp/sandbox/txcache/src/RUBiS-1.4.3/bench/2009-3-20@2:33:9//web_server0.bin
Command is: /usr/bin/ssh -x localhost /bin/bash -c 'LANG=en_GB.UTF-8 /usr/bin/sar -n DEV -n SOCK -rubcw 1 605 -f /home/drkp/sandbox/txcache/src/RUBiS-1.4.3/bench/2009-3-20@2:33:9//web_server0.bin > /home/drkp/sandbox/txcache/src/RUBiS-1.4.3/bench/2009-3-20@2:33:9//web_server0'
Command is: /usr/bin/scp farm13.csail.mit.edu:/tmp/web_server1 /home/drkp/sandbox/txcache/src/RUBiS-1.4.3/bench/2009-3-20@2:33:9//web_server1.bin
Command is: /usr/bin/ssh -x localhost /bin/bash -c 'LANG=en_GB.UTF-8 /usr/bin/sar -n DEV -n SOCK -rubcw 1 605 -f /home/drkp/sandbox/txcache/src/RUBiS-1.4.3/bench/2009-3-20@2:33:9//web_server1.bin > /home/drkp/sandbox/txcache/src/RUBiS-1.4.3/bench/2009-3-20@2:33:9//web_server1'
Command is: /usr/bin/scp localhost:/tmp/client0 /home/drkp/sandbox/txcache/src/RUBiS-1.4.3/bench/2009-3-20@2:33:9//client0.bin
Command is: /usr/bin/ssh -x localhost /bin/bash -c 'LANG=en_GB.UTF-8 /usr/bin/sar -n DEV -n SOCK -rubcw 1 605 -f /home/drkp/sandbox/txcache/src/RUBiS-1.4.3/bench/2009-3-20@2:33:9//client0.bin > /home/drkp/sandbox/txcache/src/RUBiS-1.4.3/bench/2009-3-20@2:33:9//client0'
Command is: /usr/bin/scp farm6.csail.mit.edu:/tmp/trace_client1.html /home/drkp/sandbox/txcache/src/RUBiS-1.4.3/bench/2009-3-20@2:33:9//
Command is: /usr/bin/scp farm6.csail.mit.edu:/tmp/stat_client1.html /home/drkp/sandbox/txcache/src/RUBiS-1.4.3/bench/2009-3-20@2:33:9//
|
|
|
|
|
|
 | 
|
 | 
|
 | 
|
 | 
|
 | 
|
 | 
|
 | 
|
 | 
|
 | 
|