Node information
Test timing information
Up ramp statistics
Runtime session statistics
Down ramp statistics
Overall statistics
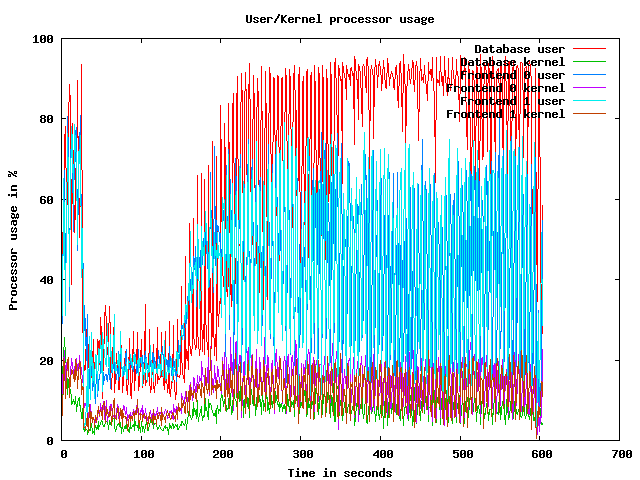
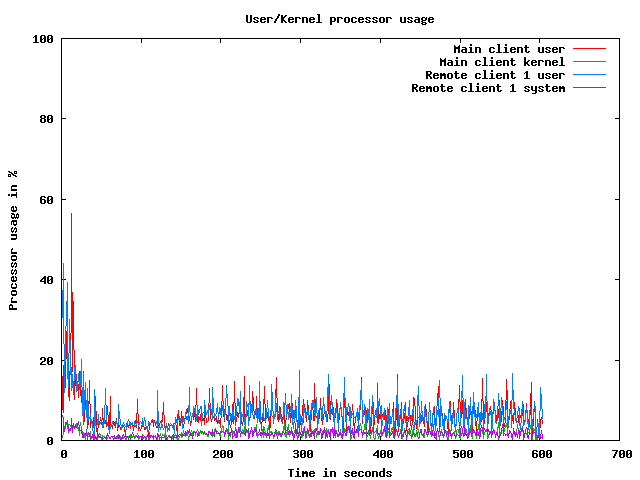
CPU usage graphs
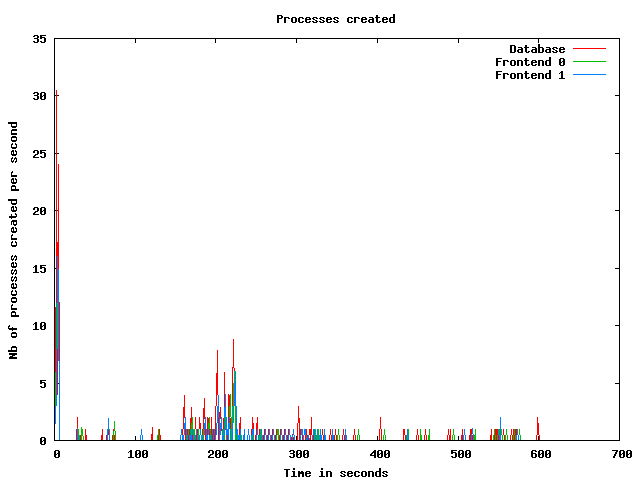
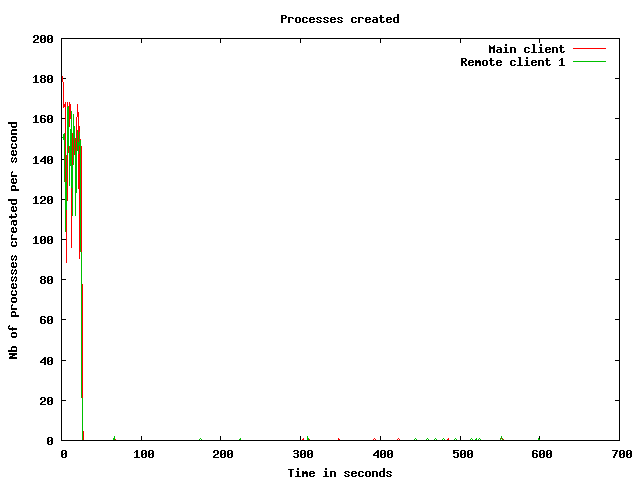
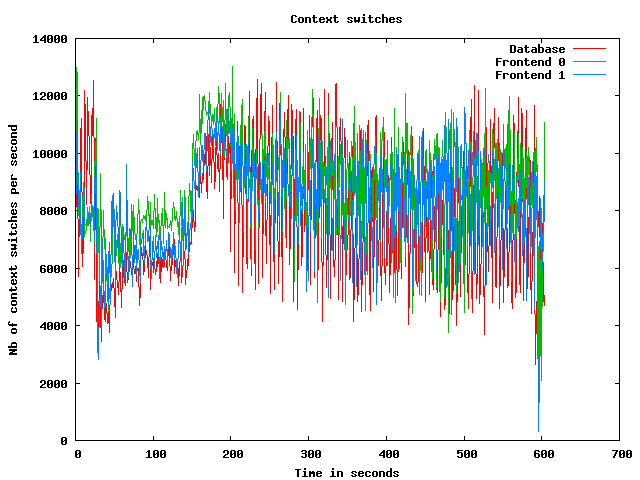
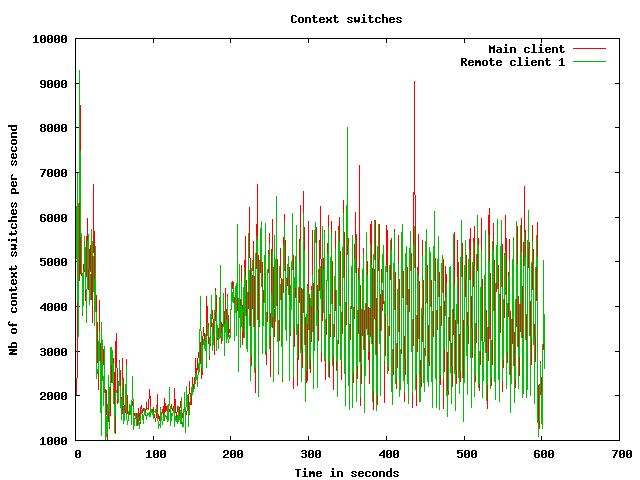
Processes usage graphs
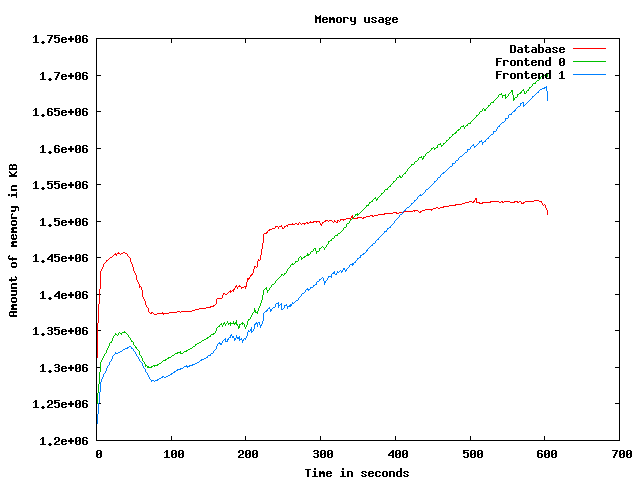
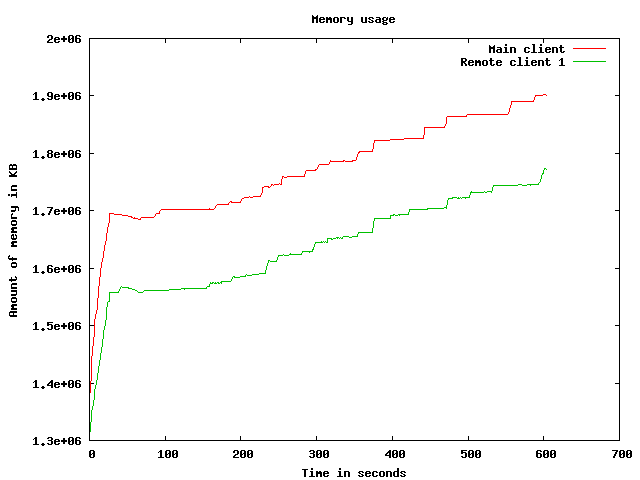
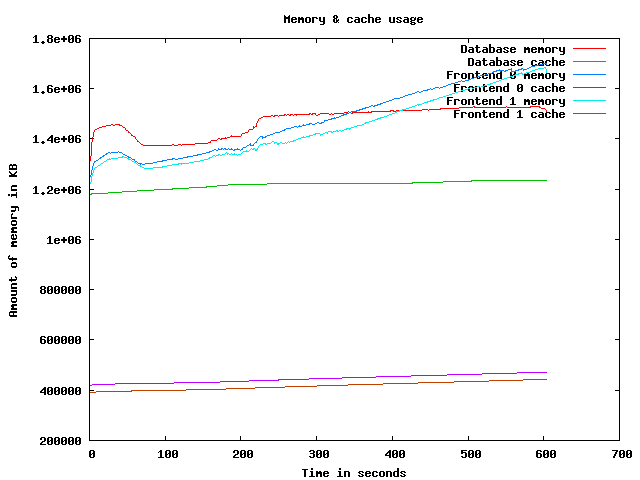
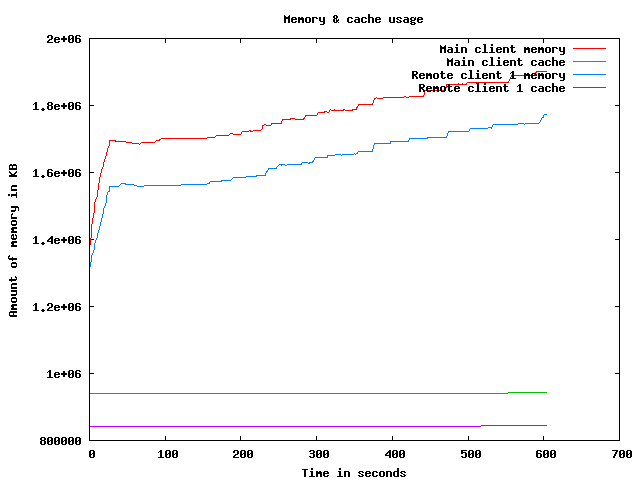
Memory usage graph
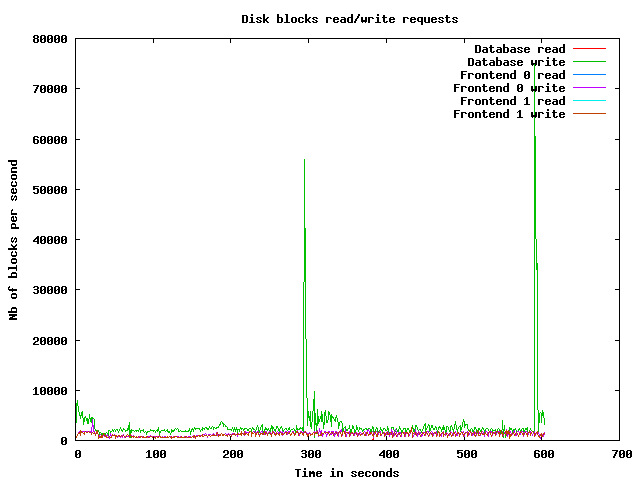
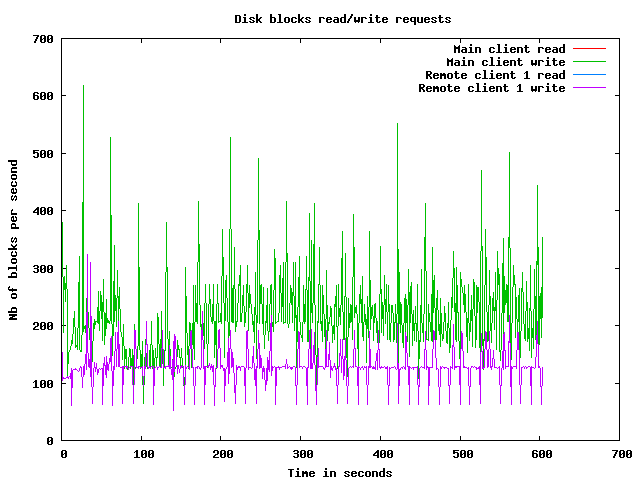
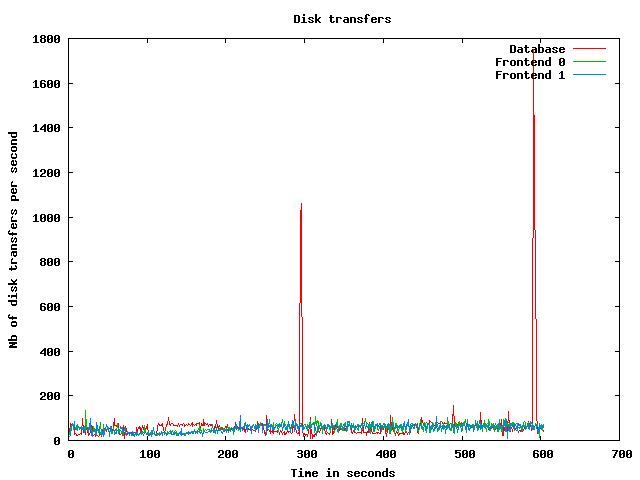
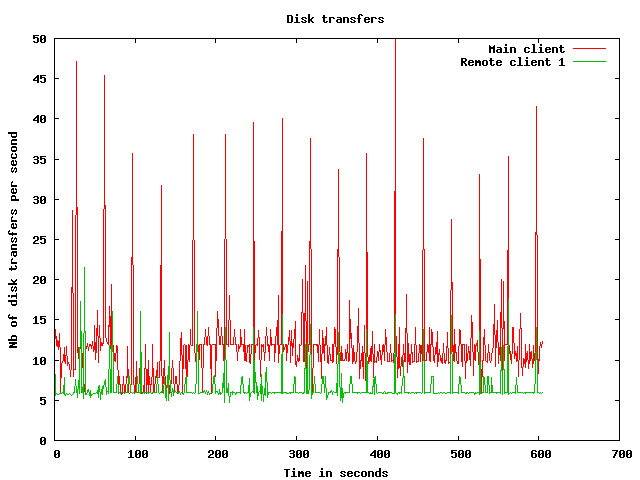
Disk usage graphs
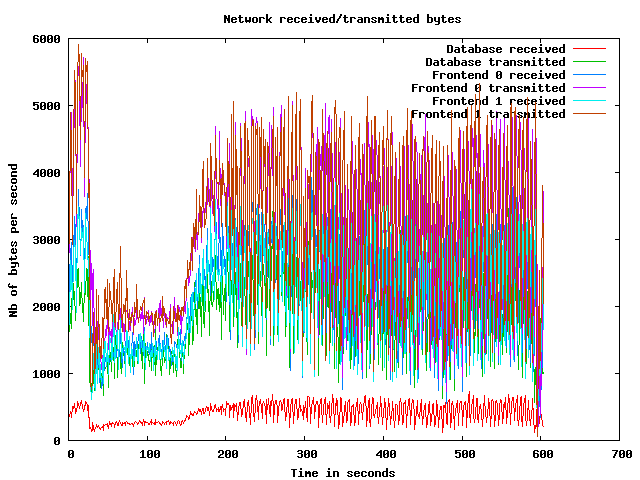
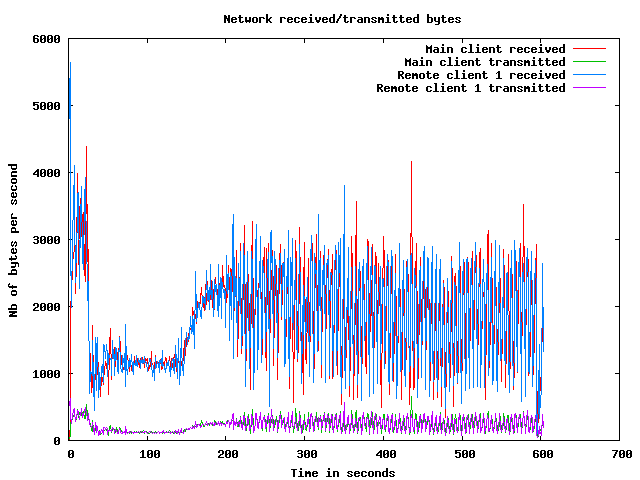
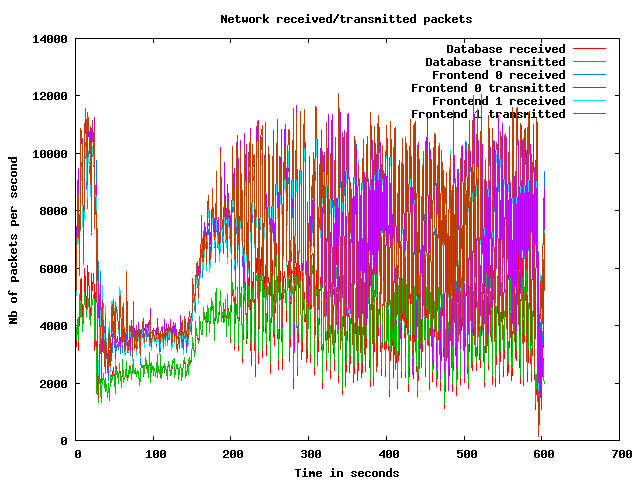
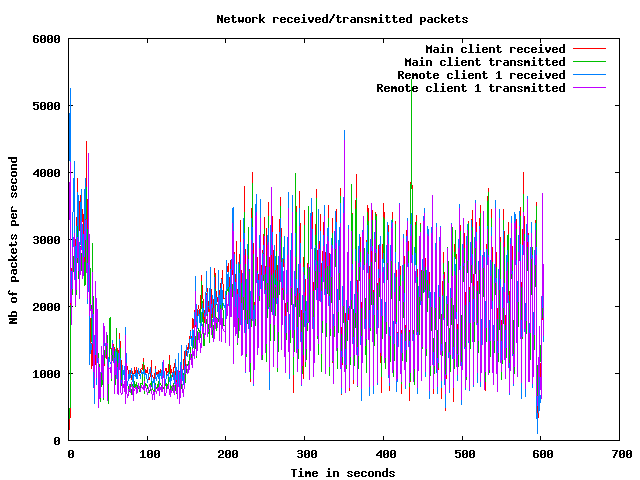
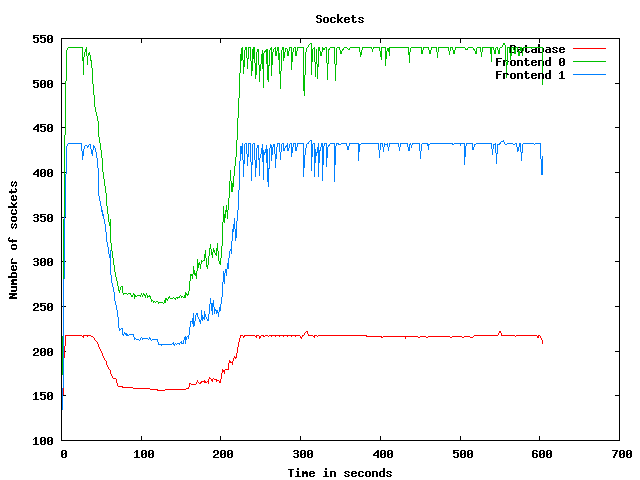
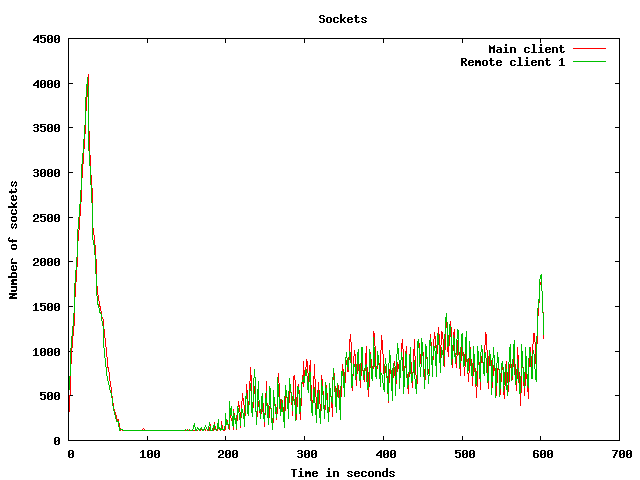
Network usage graphs
| Test start | 2009-3-20 2:46:18 |
| Up ramp start | 2009-3-20 2:46:46 |
| Runtime session start | 2009-3-20 2:48:46 |
| Down ramp start | 2009-3-20 2:56:16 |
| Test end | 2009-3-20 2:58:55 |
| Up ramp length | 2 minutes 18 milliseconds (requested 120000 ms) |
| Runtime session length | 7 minutes 30 seconds 1 millisecond (requested 450000 ms) |
| Down ramp length | 30 seconds 0 millisecond (requested 30000 ms) |
| Total test length | 12 minutes 36 seconds 811 milliseconds |
| State name | % of total | Count | Errors | Minimum Time | Maximum Time | Average Time |
|---|---|---|---|---|---|---|
Home | 9 % | 6254 | 0 | 0 ms | 59093 ms | 5575 ms
|
Register | 1 % | 893 | 0 | 0 ms | 45031 ms | 1530 ms
|
RegisterUser | 1 % | 839 | 7 | 4 ms | 45447 ms | 1697 ms
|
Browse | 9 % | 6264 | 0 | 0 ms | 45385 ms | 2074 ms
|
BrowseCategories | 6 % | 4142 | 0 | 3 ms | 45338 ms | 1640 ms
|
SearchItemsInCategory | 15 % | 9750 | 0 | 0 ms | 45434 ms | 1097 ms
|
BrowseRegions | 2 % | 1716 | 0 | 3 ms | 45245 ms | 1363 ms
|
BrowseCategoriesInRegion | 2 % | 1604 | 0 | 3 ms | 45220 ms | 1678 ms
|
SearchItemsInRegion | 4 % | 3213 | 0 | 0 ms | 45157 ms | 875 ms
|
ViewItem | 12 % | 8162 | 0 | 3 ms | 56130 ms | 1054 ms
|
ViewUserInfo | 2 % | 1400 | 0 | 3 ms | 45453 ms | 817 ms
|
ViewBidHistory | 1 % | 691 | 0 | 3 ms | 45167 ms | 1020 ms
|
BuyNowAuth | 1 % | 670 | 0 | 2 ms | 45068 ms | 913 ms
|
BuyNow | 0 % | 586 | 105 | 4 ms | 45026 ms | 1045 ms
|
StoreBuyBow | 0 % | 420 | 0 | 4 ms | 45007 ms | 733 ms
|
PutBidAuth | 4 % | 2695 | 0 | 0 ms | 45221 ms | 1004 ms
|
PutBid | 4 % | 2588 | 325 | 5 ms | 45452 ms | 702 ms
|
StoreBid | 2 % | 1533 | 1 | 4 ms | 45128 ms | 1023 ms
|
PutCommentAuth | 0 % | 0 | 0 | 0 ms | 0 ms | 0 ms
|
PutComment | 0 % | 209 | 21 | 4 ms | 45013 ms | 740 ms
|
StoreComment | 0 % | 163 | 0 | 4 ms | 45010 ms | 1117 ms
|
Sell | 0 % | 463 | 0 | 0 ms | 45003 ms | 1576 ms
|
SelectCategoryToSellItem | 0 % | 431 | 0 | 4 ms | 45053 ms | 1403 ms
|
SellItemForm | 0 % | 384 | 0 | 2 ms | 45051 ms | 1233 ms
|
RegisterItem | 0 % | 351 | 0 | 4 ms | 45044 ms | 1295 ms
|
AboutMe (auth form) | 2 % | 1338 | 0 | 0 ms | 45401 ms | 2362 ms
|
AboutMe | 2 % | 1862 | 0 | 4 ms | 45401 ms | 1596 ms
|
Back probability | 7 % | 5003 | 0 | 0 ms | 0 ms | 0 ms
|
End of Session | 1 % | 643 | 0 | 0 ms | 0 ms | 0 ms
|
Total | 100 % | 64267 | 459 | - | - | 1588 ms
|
Average throughput | 539 req/s
| |||||
Completed sessions | 598
| |||||
Total time | 32348 seconds
| |||||
Average session time | 54 seconds
| |||||
| State name | % of total | Count | Errors | Minimum Time | Maximum Time | Average Time |
|---|---|---|---|---|---|---|
Home | 4 % | 11479 | 0 | 0 ms | 189997 ms | 370 ms
|
Register | 1 % | 2701 | 0 | 0 ms | 93687 ms | 899 ms
|
RegisterUser | 1 % | 2656 | 59 | 6 ms | 190121 ms | 1020 ms
|
Browse | 7 % | 18209 | 0 | 0 ms | 190396 ms | 977 ms
|
BrowseCategories | 4 % | 12657 | 0 | 3 ms | 190010 ms | 1037 ms
|
SearchItemsInCategory | 15 % | 40246 | 0 | 0 ms | 190428 ms | 1102 ms
|
BrowseRegions | 2 % | 5364 | 0 | 3 ms | 93966 ms | 941 ms
|
BrowseCategoriesInRegion | 2 % | 5261 | 0 | 3 ms | 93694 ms | 912 ms
|
SearchItemsInRegion | 5 % | 12952 | 0 | 0 ms | 94458 ms | 1082 ms
|
ViewItem | 14 % | 36522 | 0 | 3 ms | 190469 ms | 1041 ms
|
ViewUserInfo | 3 % | 8353 | 0 | 3 ms | 190121 ms | 1005 ms
|
ViewBidHistory | 1 % | 4308 | 0 | 4 ms | 190181 ms | 1244 ms
|
BuyNowAuth | 1 % | 3365 | 0 | 2 ms | 189996 ms | 1009 ms
|
BuyNow | 1 % | 3322 | 469 | 5 ms | 96821 ms | 1011 ms
|
StoreBuyBow | 1 % | 2802 | 3 | 4 ms | 93662 ms | 1058 ms
|
PutBidAuth | 4 % | 12631 | 0 | 0 ms | 190042 ms | 1003 ms
|
PutBid | 5 % | 14467 | 1743 | 1 ms | 190098 ms | 973 ms
|
StoreBid | 3 % | 9486 | 12 | 4 ms | 190070 ms | 1020 ms
|
PutCommentAuth | 0 % | 0 | 0 | 0 ms | 0 ms | 0 ms
|
PutComment | 0 % | 1176 | 92 | 5 ms | 93944 ms | 1038 ms
|
StoreComment | 0 % | 1069 | 0 | 5 ms | 93721 ms | 1014 ms
|
Sell | 0 % | 1417 | 0 | 0 ms | 93864 ms | 916 ms
|
SelectCategoryToSellItem | 0 % | 1404 | 0 | 5 ms | 94018 ms | 959 ms
|
SellItemForm | 0 % | 1384 | 0 | 2 ms | 93824 ms | 1013 ms
|
RegisterItem | 0 % | 1353 | 0 | 4 ms | 190020 ms | 1337 ms
|
AboutMe (auth form) | 1 % | 4156 | 0 | 0 ms | 94033 ms | 956 ms
|
AboutMe | 2 % | 7033 | 0 | 5 ms | 94274 ms | 1081 ms
|
Back probability | 10 % | 26763 | 0 | 0 ms | 0 ms | 0 ms
|
End of Session | 1 % | 3701 | 0 | 0 ms | 0 ms | 0 ms
|
Total | 100 % | 256237 | 2378 | - | - | 874 ms
|
Average throughput | 574 req/s
| |||||
Completed sessions | 3693
| |||||
Total time | 958884 seconds
| |||||
Average session time | 259 seconds
| |||||
| State name | % of total | Count | Errors | Minimum Time | Maximum Time | Average Time |
|---|---|---|---|---|---|---|
Home | 4 % | 376 | 0 | 0 ms | 92994 ms | 1013 ms
|
Register | 1 % | 91 | 0 | 0 ms | 93000 ms | 3544 ms
|
RegisterUser | 0 % | 84 | 3 | 5 ms | 21064 ms | 2415 ms
|
Browse | 7 % | 647 | 0 | 0 ms | 189999 ms | 3641 ms
|
BrowseCategories | 4 % | 433 | 0 | 3 ms | 190006 ms | 3813 ms
|
SearchItemsInCategory | 15 % | 1334 | 0 | 1 ms | 93013 ms | 3289 ms
|
BrowseRegions | 2 % | 177 | 0 | 3 ms | 190002 ms | 3560 ms
|
BrowseCategoriesInRegion | 2 % | 182 | 0 | 3 ms | 93005 ms | 2686 ms
|
SearchItemsInRegion | 4 % | 425 | 0 | 0 ms | 93116 ms | 3364 ms
|
ViewItem | 14 % | 1267 | 0 | 3 ms | 190094 ms | 3564 ms
|
ViewUserInfo | 3 % | 277 | 0 | 3 ms | 93024 ms | 3907 ms
|
ViewBidHistory | 1 % | 137 | 0 | 5 ms | 45003 ms | 2948 ms
|
BuyNowAuth | 1 % | 124 | 0 | 2 ms | 21007 ms | 2805 ms
|
BuyNow | 1 % | 114 | 13 | 6 ms | 190008 ms | 3618 ms
|
StoreBuyBow | 1 % | 96 | 0 | 5 ms | 21017 ms | 2140 ms
|
PutBidAuth | 5 % | 456 | 0 | 0 ms | 190004 ms | 4367 ms
|
PutBid | 5 % | 484 | 73 | 5 ms | 190016 ms | 3808 ms
|
StoreBid | 3 % | 304 | 1 | 4 ms | 190018 ms | 4731 ms
|
PutCommentAuth | 0 % | 0 | 0 | 0 ms | 0 ms | 0 ms
|
PutComment | 0 % | 41 | 3 | 4 ms | 45007 ms | 3735 ms
|
StoreComment | 0 % | 38 | 0 | 5 ms | 21024 ms | 3075 ms
|
Sell | 0 % | 45 | 0 | 0 ms | 21504 ms | 2701 ms
|
SelectCategoryToSellItem | 0 % | 39 | 0 | 5 ms | 45007 ms | 6751 ms
|
SellItemForm | 0 % | 38 | 0 | 2 ms | 21449 ms | 5443 ms
|
RegisterItem | 0 % | 49 | 0 | 5 ms | 93023 ms | 4393 ms
|
AboutMe (auth form) | 1 % | 134 | 0 | 0 ms | 92996 ms | 3631 ms
|
AboutMe | 2 % | 239 | 0 | 12 ms | 21620 ms | 2607 ms
|
Back probability | 11 % | 974 | 0 | 0 ms | 0 ms | 0 ms
|
End of Session | 1 % | 125 | 0 | 0 ms | 0 ms | 0 ms
|
Total | 100 % | 8730 | 93 | - | - | 2978 ms
|
Average throughput | 294 req/s
| |||||
Completed sessions | 108
| |||||
Total time | 42722 seconds
| |||||
Average session time | 395 seconds
| |||||
| State name | % of total | Count | Errors | Minimum Time | Maximum Time | Average Time |
|---|---|---|---|---|---|---|
Home | 5 % | 18109 | 0 | 0 ms | 189997 ms | 2186 ms
|
Register | 1 % | 3686 | 0 | 0 ms | 93687 ms | 1193 ms
|
RegisterUser | 1 % | 3582 | 69 | 4 ms | 190121 ms | 1223 ms
|
Browse | 7 % | 25132 | 0 | 0 ms | 190396 ms | 1361 ms
|
BrowseCategories | 5 % | 17241 | 0 | 3 ms | 190023 ms | 1289 ms
|
SearchItemsInCategory | 15 % | 51570 | 0 | 0 ms | 190428 ms | 1179 ms
|
BrowseRegions | 2 % | 7258 | 0 | 3 ms | 190032 ms | 1170 ms
|
BrowseCategoriesInRegion | 2 % | 7050 | 0 | 3 ms | 93694 ms | 1131 ms
|
SearchItemsInRegion | 5 % | 16649 | 0 | 0 ms | 190008 ms | 1133 ms
|
ViewItem | 13 % | 46057 | 0 | 3 ms | 190469 ms | 1124 ms
|
ViewUserInfo | 3 % | 10065 | 0 | 3 ms | 190121 ms | 1065 ms
|
ViewBidHistory | 1 % | 5152 | 0 | 3 ms | 190181 ms | 1310 ms
|
BuyNowAuth | 1 % | 4160 | 0 | 2 ms | 189996 ms | 1058 ms
|
BuyNow | 1 % | 4023 | 587 | 4 ms | 190008 ms | 1112 ms
|
StoreBuyBow | 1 % | 3320 | 3 | 4 ms | 93662 ms | 1061 ms
|
PutBidAuth | 4 % | 15784 | 0 | 0 ms | 190042 ms | 1106 ms
|
PutBid | 5 % | 17592 | 2141 | 1 ms | 190098 ms | 1029 ms
|
StoreBid | 3 % | 11328 | 14 | 4 ms | 190070 ms | 1160 ms
|
PutCommentAuth | 0 % | 0 | 0 | 0 ms | 0 ms | 0 ms
|
PutComment | 0 % | 1426 | 116 | 4 ms | 93944 ms | 1072 ms
|
StoreComment | 0 % | 1270 | 0 | 4 ms | 93721 ms | 1235 ms
|
Sell | 0 % | 1925 | 0 | 0 ms | 93864 ms | 1165 ms
|
SelectCategoryToSellItem | 0 % | 1875 | 0 | 4 ms | 94018 ms | 1181 ms
|
SellItemForm | 0 % | 1806 | 0 | 2 ms | 190029 ms | 1335 ms
|
RegisterItem | 0 % | 1756 | 0 | 4 ms | 190020 ms | 1490 ms
|
AboutMe (auth form) | 1 % | 5628 | 0 | 0 ms | 94033 ms | 1386 ms
|
AboutMe | 2 % | 9194 | 0 | 4 ms | 94274 ms | 1217 ms
|
Back probability | 9 % | 32747 | 0 | 0 ms | 0 ms | 0 ms
|
End of Session | 1 % | 4471 | 0 | 0 ms | 0 ms | 0 ms
|
Total | 100 % | 329856 | 2930 | - | - | 1090 ms
|
Average throughput | 554 req/s
| |||||
Completed sessions | 4471
| |||||
Total time | 1061858 seconds
| |||||
Average session time | 237 seconds
| |||||
An error occured while waiting for remote processes termination (Skipping waits)
Command is: /usr/bin/scp farm6.csail.mit.edu:/tmp/client1 /home/drkp/sandbox/txcache/src/RUBiS-1.4.3/bench/2009-3-20@2:46:18//client1.bin
Command is: /usr/bin/ssh -x localhost /bin/bash -c 'LANG=en_GB.UTF-8 /usr/bin/sar -n DEV -n SOCK -rubcw 1 605 -f /home/drkp/sandbox/txcache/src/RUBiS-1.4.3/bench/2009-3-20@2:46:18//client1.bin > /home/drkp/sandbox/txcache/src/RUBiS-1.4.3/bench/2009-3-20@2:46:18//client1'
Command is: /usr/bin/scp farm14:/tmp/db_server0 /home/drkp/sandbox/txcache/src/RUBiS-1.4.3/bench/2009-3-20@2:46:18//db_server0.bin
Command is: /usr/bin/ssh -x localhost /bin/bash -c 'LANG=en_GB.UTF-8 /usr/bin/sar -n DEV -n SOCK -rubcw 1 605 -f /home/drkp/sandbox/txcache/src/RUBiS-1.4.3/bench/2009-3-20@2:46:18//db_server0.bin > /home/drkp/sandbox/txcache/src/RUBiS-1.4.3/bench/2009-3-20@2:46:18//db_server0'
Command is: /usr/bin/scp farm12.csail.mit.edu:/tmp/web_server0 /home/drkp/sandbox/txcache/src/RUBiS-1.4.3/bench/2009-3-20@2:46:18//web_server0.bin
Command is: /usr/bin/ssh -x localhost /bin/bash -c 'LANG=en_GB.UTF-8 /usr/bin/sar -n DEV -n SOCK -rubcw 1 605 -f /home/drkp/sandbox/txcache/src/RUBiS-1.4.3/bench/2009-3-20@2:46:18//web_server0.bin > /home/drkp/sandbox/txcache/src/RUBiS-1.4.3/bench/2009-3-20@2:46:18//web_server0'
Command is: /usr/bin/scp farm13.csail.mit.edu:/tmp/web_server1 /home/drkp/sandbox/txcache/src/RUBiS-1.4.3/bench/2009-3-20@2:46:18//web_server1.bin
Command is: /usr/bin/ssh -x localhost /bin/bash -c 'LANG=en_GB.UTF-8 /usr/bin/sar -n DEV -n SOCK -rubcw 1 605 -f /home/drkp/sandbox/txcache/src/RUBiS-1.4.3/bench/2009-3-20@2:46:18//web_server1.bin > /home/drkp/sandbox/txcache/src/RUBiS-1.4.3/bench/2009-3-20@2:46:18//web_server1'
Command is: /usr/bin/scp localhost:/tmp/client0 /home/drkp/sandbox/txcache/src/RUBiS-1.4.3/bench/2009-3-20@2:46:18//client0.bin
Command is: /usr/bin/ssh -x localhost /bin/bash -c 'LANG=en_GB.UTF-8 /usr/bin/sar -n DEV -n SOCK -rubcw 1 605 -f /home/drkp/sandbox/txcache/src/RUBiS-1.4.3/bench/2009-3-20@2:46:18//client0.bin > /home/drkp/sandbox/txcache/src/RUBiS-1.4.3/bench/2009-3-20@2:46:18//client0'
Command is: /usr/bin/scp farm6.csail.mit.edu:/tmp/trace_client1.html /home/drkp/sandbox/txcache/src/RUBiS-1.4.3/bench/2009-3-20@2:46:18//
Command is: /usr/bin/scp farm6.csail.mit.edu:/tmp/stat_client1.html /home/drkp/sandbox/txcache/src/RUBiS-1.4.3/bench/2009-3-20@2:46:18//
|
|
|
|
|
|
 | 
|
 | 
|
 | 
|
 | 
|
 | 
|
 | 
|
 | 
|
 | 
|
 | 
|