Node information
Test timing information
Up ramp statistics
Runtime session statistics
Down ramp statistics
Overall statistics
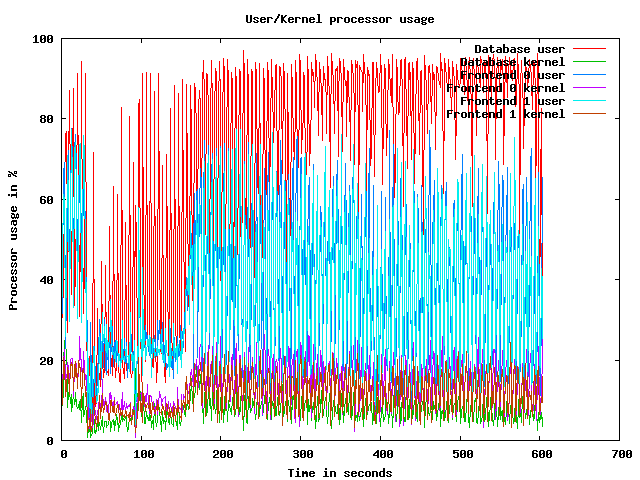
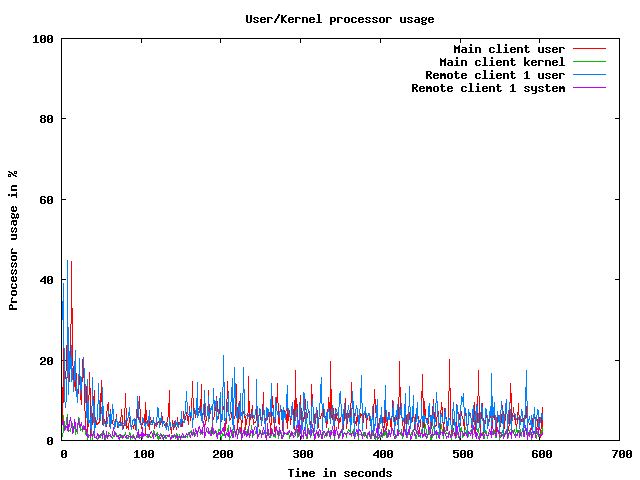
CPU usage graphs
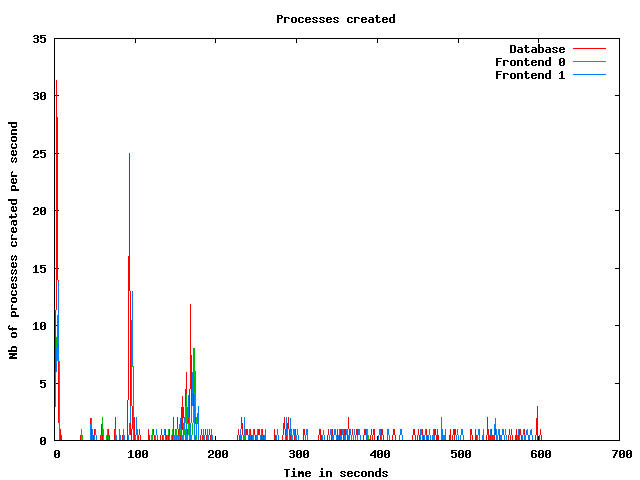
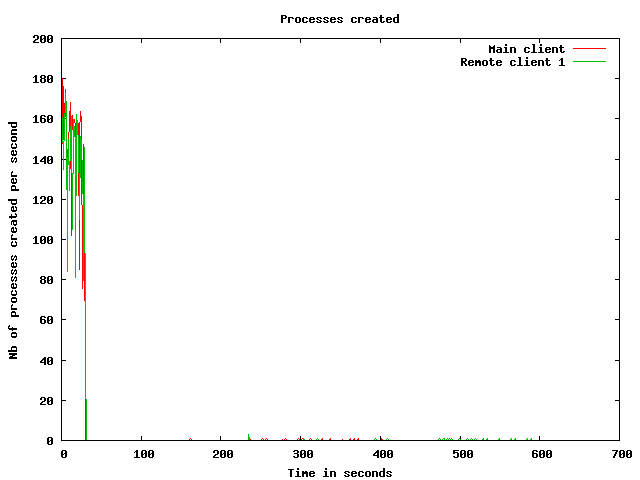
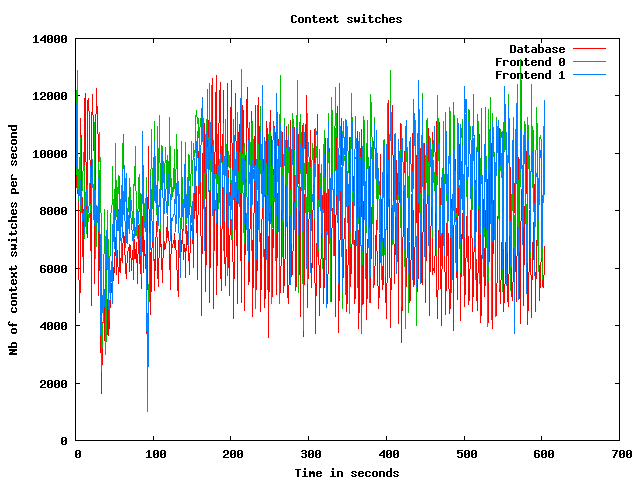
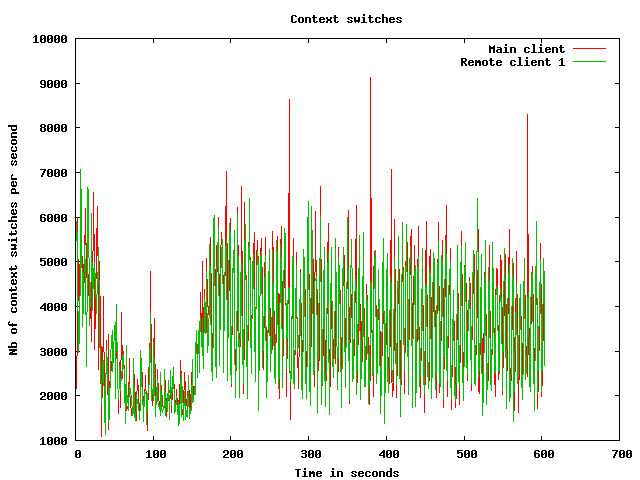
Processes usage graphs
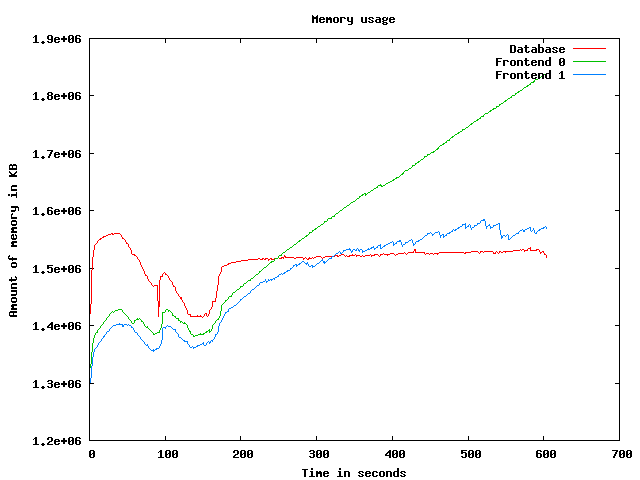
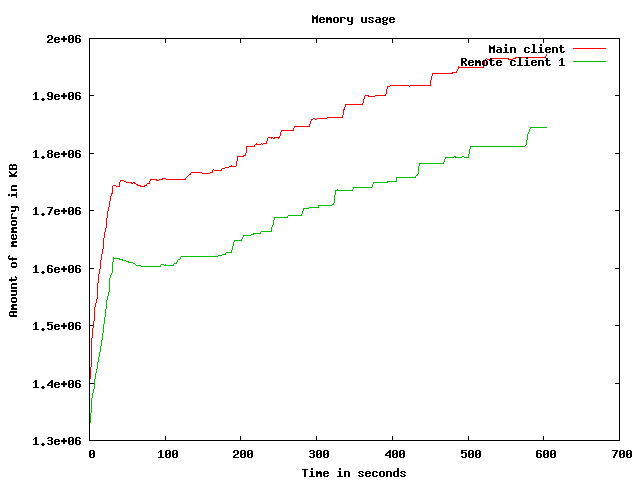
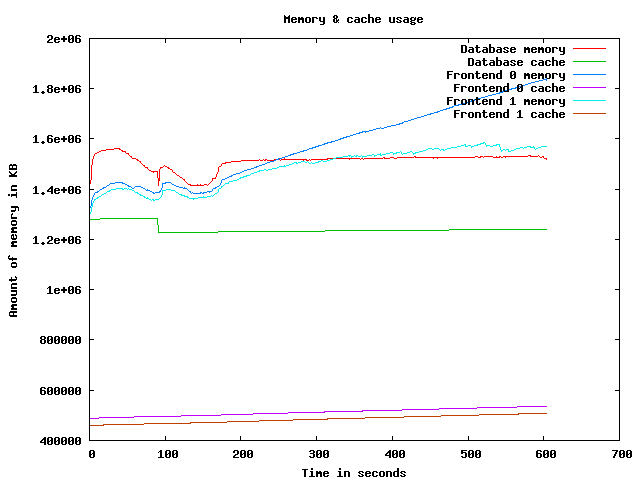
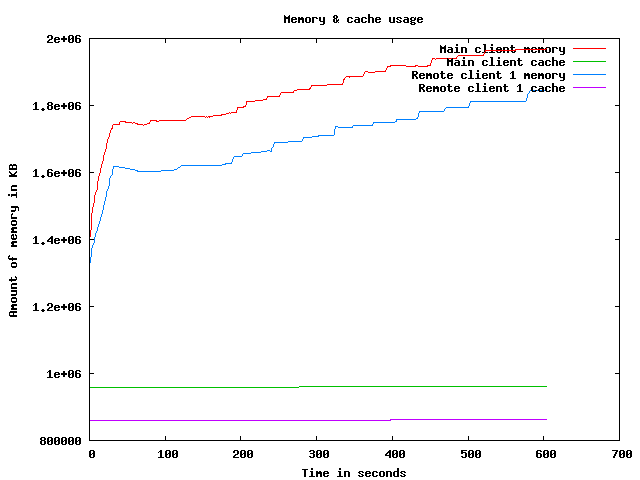
Memory usage graph
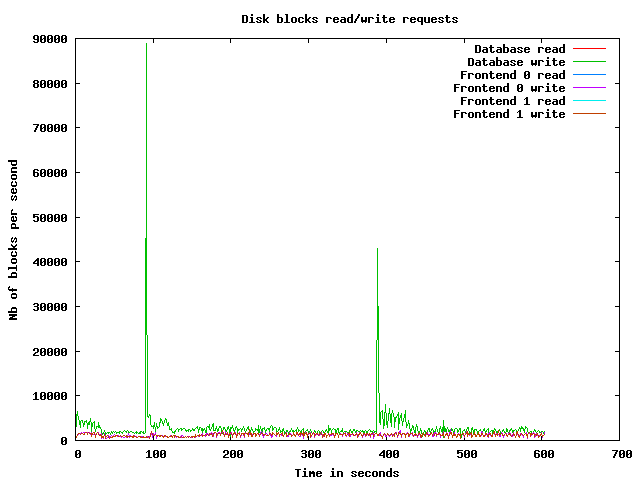
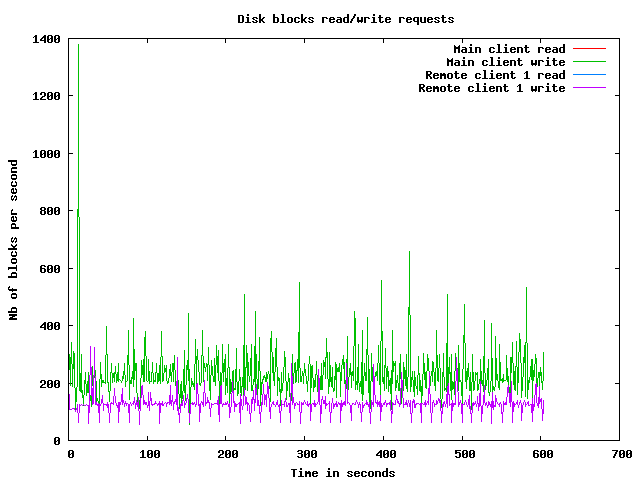
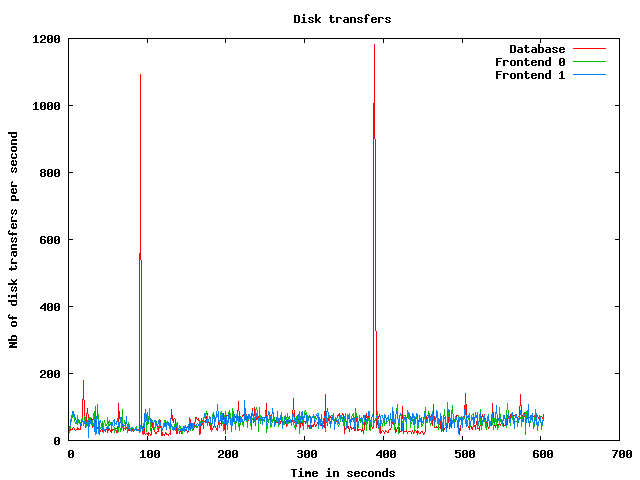
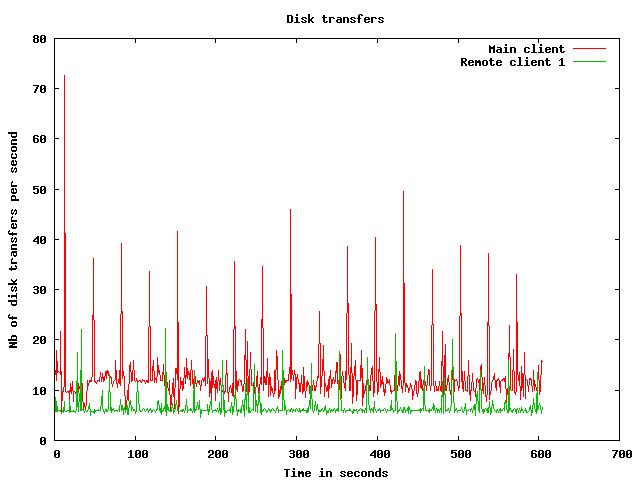
Disk usage graphs
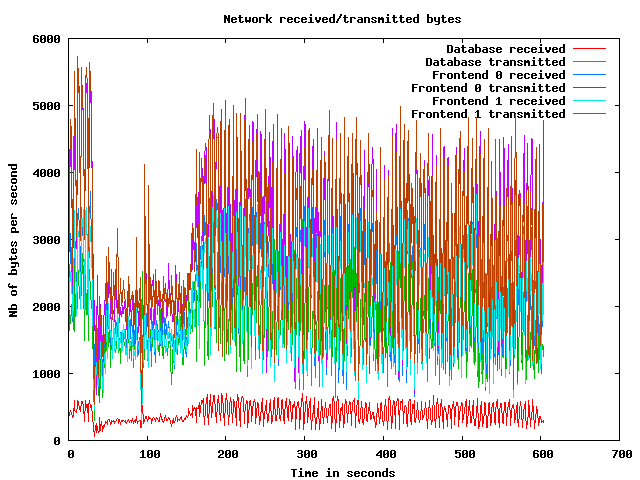
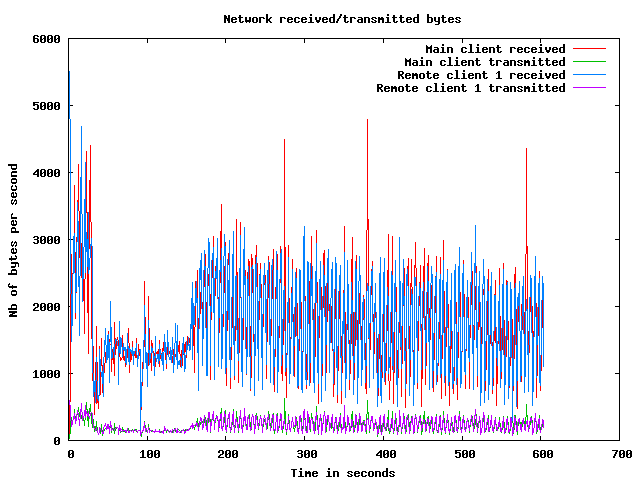
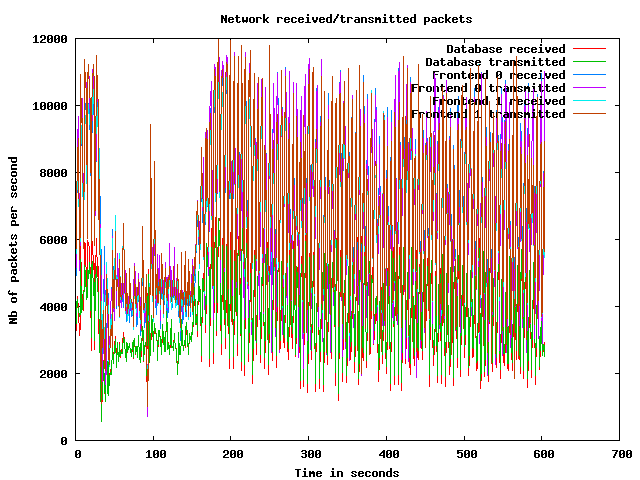
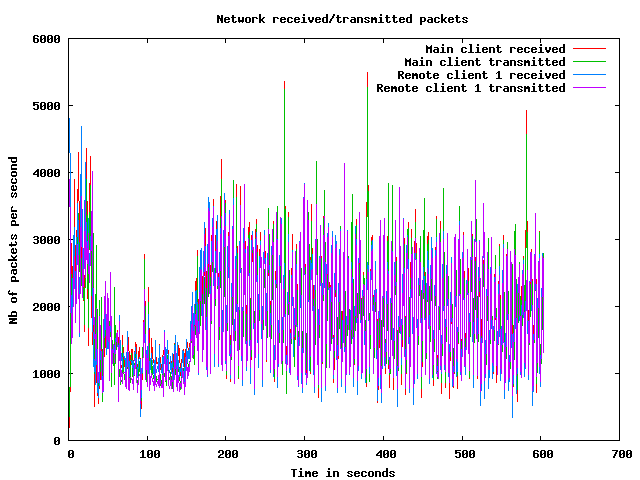
Network usage graphs
| Test start | 2009-3-20 2:59:42 |
| Up ramp start | 2009-3-20 3:0:14 |
| Runtime session start | 2009-3-20 3:2:14 |
| Down ramp start | 2009-3-20 3:9:44 |
| Test end | 2009-3-20 3:12:32 |
| Up ramp length | 2 minutes 1 millisecond (requested 120000 ms) |
| Runtime session length | 7 minutes 30 seconds 0 millisecond (requested 450000 ms) |
| Down ramp length | 30 seconds 0 millisecond (requested 30000 ms) |
| Total test length | 12 minutes 49 seconds 966 milliseconds |
| State name | % of total | Count | Errors | Minimum Time | Maximum Time | Average Time |
|---|---|---|---|---|---|---|
Home | 9 % | 7000 | 0 | 0 ms | 94752 ms | 6041 ms
|
Register | 1 % | 993 | 0 | 0 ms | 48965 ms | 1986 ms
|
RegisterUser | 1 % | 913 | 15 | 5 ms | 45180 ms | 1554 ms
|
Browse | 9 % | 6914 | 0 | 0 ms | 59111 ms | 2449 ms
|
BrowseCategories | 6 % | 4611 | 0 | 3 ms | 48942 ms | 1795 ms
|
SearchItemsInCategory | 14 % | 10521 | 0 | 1 ms | 48975 ms | 1412 ms
|
BrowseRegions | 2 % | 1850 | 0 | 3 ms | 46021 ms | 1780 ms
|
BrowseCategoriesInRegion | 2 % | 1723 | 0 | 3 ms | 45663 ms | 1639 ms
|
SearchItemsInRegion | 4 % | 3420 | 0 | 0 ms | 46017 ms | 1292 ms
|
ViewItem | 12 % | 8825 | 0 | 3 ms | 94589 ms | 1421 ms
|
ViewUserInfo | 2 % | 1578 | 0 | 3 ms | 45220 ms | 1020 ms
|
ViewBidHistory | 1 % | 829 | 0 | 3 ms | 45730 ms | 1025 ms
|
BuyNowAuth | 1 % | 789 | 0 | 2 ms | 45015 ms | 953 ms
|
BuyNow | 0 % | 700 | 111 | 4 ms | 45052 ms | 873 ms
|
StoreBuyBow | 0 % | 523 | 0 | 5 ms | 45621 ms | 1795 ms
|
PutBidAuth | 4 % | 3015 | 0 | 0 ms | 45805 ms | 1417 ms
|
PutBid | 4 % | 2962 | 369 | 1 ms | 45478 ms | 1100 ms
|
StoreBid | 2 % | 1737 | 0 | 4 ms | 45275 ms | 1103 ms
|
PutCommentAuth | 0 % | 0 | 0 | 0 ms | 0 ms | 0 ms
|
PutComment | 0 % | 253 | 21 | 4 ms | 45148 ms | 697 ms
|
StoreComment | 0 % | 208 | 0 | 5 ms | 21006 ms | 420 ms
|
Sell | 0 % | 500 | 0 | 0 ms | 48985 ms | 1901 ms
|
SelectCategoryToSellItem | 0 % | 459 | 0 | 4 ms | 45830 ms | 1903 ms
|
SellItemForm | 0 % | 416 | 0 | 2 ms | 45022 ms | 1339 ms
|
RegisterItem | 0 % | 379 | 0 | 5 ms | 45609 ms | 1837 ms
|
AboutMe (auth form) | 2 % | 1558 | 0 | 0 ms | 65104 ms | 2105 ms
|
AboutMe | 3 % | 2191 | 0 | 6 ms | 45646 ms | 1700 ms
|
Back probability | 7 % | 5409 | 0 | 0 ms | 0 ms | 0 ms
|
End of Session | 1 % | 773 | 0 | 0 ms | 0 ms | 0 ms
|
Total | 100 % | 71049 | 516 | - | - | 1864 ms
|
Average throughput | 596 req/s
| |||||
Completed sessions | 697
| |||||
Total time | 39018 seconds
| |||||
Average session time | 55 seconds
| |||||
| State name | % of total | Count | Errors | Minimum Time | Maximum Time | Average Time |
|---|---|---|---|---|---|---|
Home | 4 % | 10112 | 0 | 0 ms | 284411 ms | 1572 ms
|
Register | 1 % | 2504 | 0 | 0 ms | 193561 ms | 2541 ms
|
RegisterUser | 1 % | 2454 | 67 | 5 ms | 193758 ms | 2388 ms
|
Browse | 7 % | 16414 | 0 | 0 ms | 239839 ms | 2410 ms
|
BrowseCategories | 4 % | 11376 | 0 | 3 ms | 249156 ms | 2461 ms
|
SearchItemsInCategory | 15 % | 35437 | 0 | 0 ms | 291985 ms | 2659 ms
|
BrowseRegions | 2 % | 4815 | 0 | 3 ms | 249144 ms | 2437 ms
|
BrowseCategoriesInRegion | 2 % | 4731 | 0 | 3 ms | 239082 ms | 2350 ms
|
SearchItemsInRegion | 5 % | 11691 | 0 | 0 ms | 249162 ms | 2449 ms
|
ViewItem | 14 % | 32473 | 0 | 3 ms | 296871 ms | 2589 ms
|
ViewUserInfo | 3 % | 7315 | 0 | 3 ms | 248866 ms | 2531 ms
|
ViewBidHistory | 1 % | 3969 | 0 | 3 ms | 249162 ms | 2546 ms
|
BuyNowAuth | 1 % | 3048 | 0 | 2 ms | 276686 ms | 2504 ms
|
BuyNow | 1 % | 3014 | 428 | 5 ms | 284469 ms | 2814 ms
|
StoreBuyBow | 1 % | 2537 | 3 | 5 ms | 213245 ms | 2763 ms
|
PutBidAuth | 4 % | 11492 | 0 | 0 ms | 249126 ms | 2607 ms
|
PutBid | 5 % | 13222 | 1571 | 1 ms | 283548 ms | 2580 ms
|
StoreBid | 3 % | 8616 | 6 | 5 ms | 249162 ms | 2881 ms
|
PutCommentAuth | 0 % | 0 | 0 | 0 ms | 0 ms | 0 ms
|
PutComment | 0 % | 1115 | 91 | 5 ms | 235699 ms | 3004 ms
|
StoreComment | 0 % | 1006 | 0 | 5 ms | 190097 ms | 2588 ms
|
Sell | 0 % | 1299 | 0 | 0 ms | 193776 ms | 2127 ms
|
SelectCategoryToSellItem | 0 % | 1281 | 0 | 5 ms | 283553 ms | 2332 ms
|
SellItemForm | 0 % | 1268 | 0 | 2 ms | 285059 ms | 3194 ms
|
RegisterItem | 0 % | 1250 | 0 | 4 ms | 283427 ms | 2975 ms
|
AboutMe (auth form) | 1 % | 3858 | 0 | 0 ms | 283484 ms | 2567 ms
|
AboutMe | 2 % | 6636 | 0 | 4 ms | 284440 ms | 2681 ms
|
Back probability | 10 % | 23819 | 0 | 0 ms | 0 ms | 0 ms
|
End of Session | 1 % | 3264 | 0 | 0 ms | 0 ms | 0 ms
|
Total | 100 % | 230016 | 2166 | - | - | 2211 ms
|
Average throughput | 515 req/s
| |||||
Completed sessions | 3297
| |||||
Total time | 866501 seconds
| |||||
Average session time | 262 seconds
| |||||
| State name | % of total | Count | Errors | Minimum Time | Maximum Time | Average Time |
|---|---|---|---|---|---|---|
Home | 3 % | 364 | 0 | 0 ms | 190004 ms | 5662 ms
|
Register | 1 % | 105 | 0 | 0 ms | 190006 ms | 10870 ms
|
RegisterUser | 1 % | 125 | 4 | 5 ms | 190013 ms | 5965 ms
|
Browse | 7 % | 705 | 0 | 0 ms | 310947 ms | 9208 ms
|
BrowseCategories | 5 % | 513 | 0 | 3 ms | 190082 ms | 8075 ms
|
SearchItemsInCategory | 16 % | 1512 | 0 | 3 ms | 235570 ms | 10699 ms
|
BrowseRegions | 2 % | 207 | 0 | 3 ms | 193223 ms | 11447 ms
|
BrowseCategoriesInRegion | 2 % | 201 | 0 | 3 ms | 190027 ms | 13360 ms
|
SearchItemsInRegion | 4 % | 440 | 0 | 0 ms | 193234 ms | 12389 ms
|
ViewItem | 13 % | 1304 | 0 | 3 ms | 235576 ms | 8862 ms
|
ViewUserInfo | 2 % | 272 | 0 | 4 ms | 190048 ms | 12216 ms
|
ViewBidHistory | 1 % | 162 | 0 | 4 ms | 190178 ms | 11908 ms
|
BuyNowAuth | 1 % | 132 | 0 | 2 ms | 190009 ms | 5824 ms
|
BuyNow | 1 % | 120 | 17 | 5 ms | 190011 ms | 9991 ms
|
StoreBuyBow | 0 % | 93 | 0 | 5 ms | 94502 ms | 6811 ms
|
PutBidAuth | 5 % | 479 | 0 | 0 ms | 190013 ms | 14620 ms
|
PutBid | 5 % | 528 | 55 | 5 ms | 255643 ms | 10251 ms
|
StoreBid | 3 % | 357 | 0 | 5 ms | 202758 ms | 12923 ms
|
PutCommentAuth | 0 % | 0 | 0 | 0 ms | 0 ms | 0 ms
|
PutComment | 0 % | 50 | 1 | 5 ms | 190041 ms | 9916 ms
|
StoreComment | 0 % | 46 | 0 | 5 ms | 190011 ms | 15732 ms
|
Sell | 0 % | 60 | 0 | 0 ms | 190031 ms | 7790 ms
|
SelectCategoryToSellItem | 0 % | 49 | 0 | 4 ms | 190008 ms | 18092 ms
|
SellItemForm | 0 % | 49 | 0 | 2 ms | 190004 ms | 30940 ms
|
RegisterItem | 0 % | 58 | 0 | 5 ms | 190002 ms | 8373 ms
|
AboutMe (auth form) | 1 % | 158 | 0 | 0 ms | 190002 ms | 10069 ms
|
AboutMe | 2 % | 252 | 0 | 15 ms | 190091 ms | 7548 ms
|
Back probability | 10 % | 954 | 0 | 0 ms | 0 ms | 0 ms
|
End of Session | 1 % | 134 | 0 | 0 ms | 0 ms | 0 ms
|
Total | 100 % | 9429 | 77 | - | - | 9023 ms
|
Average throughput | 316 req/s
| |||||
Completed sessions | 115
| |||||
Total time | 45867 seconds
| |||||
Average session time | 398 seconds
| |||||
| State name | % of total | Count | Errors | Minimum Time | Maximum Time | Average Time |
|---|---|---|---|---|---|---|
Home | 5 % | 17480 | 0 | 0 ms | 284411 ms | 3452 ms
|
Register | 1 % | 3603 | 0 | 0 ms | 193561 ms | 2841 ms
|
RegisterUser | 1 % | 3496 | 86 | 5 ms | 193758 ms | 2755 ms
|
Browse | 7 % | 24063 | 0 | 0 ms | 310947 ms | 2755 ms
|
BrowseCategories | 5 % | 16515 | 0 | 3 ms | 380002 ms | 2633 ms
|
SearchItemsInCategory | 15 % | 47708 | 0 | 0 ms | 380086 ms | 2839 ms
|
BrowseRegions | 2 % | 6880 | 0 | 3 ms | 249144 ms | 2790 ms
|
BrowseCategoriesInRegion | 2 % | 6665 | 0 | 3 ms | 239082 ms | 2594 ms
|
SearchItemsInRegion | 5 % | 15613 | 0 | 0 ms | 282987 ms | 2644 ms
|
ViewItem | 13 % | 42768 | 0 | 3 ms | 296871 ms | 2732 ms
|
ViewUserInfo | 2 % | 9209 | 0 | 3 ms | 248866 ms | 2761 ms
|
ViewBidHistory | 1 % | 4976 | 0 | 3 ms | 249162 ms | 2703 ms
|
BuyNowAuth | 1 % | 3973 | 0 | 2 ms | 283006 ms | 2542 ms
|
BuyNow | 1 % | 3839 | 556 | 4 ms | 284469 ms | 3001 ms
|
StoreBuyBow | 1 % | 3160 | 3 | 5 ms | 213245 ms | 2954 ms
|
PutBidAuth | 4 % | 15009 | 0 | 0 ms | 249126 ms | 3029 ms
|
PutBid | 5 % | 16792 | 1999 | 1 ms | 283548 ms | 2767 ms
|
StoreBid | 3 % | 10728 | 6 | 4 ms | 249162 ms | 3125 ms
|
PutCommentAuth | 0 % | 0 | 0 | 0 ms | 0 ms | 0 ms
|
PutComment | 0 % | 1420 | 113 | 4 ms | 235699 ms | 2832 ms
|
StoreComment | 0 % | 1260 | 0 | 5 ms | 190097 ms | 2819 ms
|
Sell | 0 % | 1859 | 0 | 0 ms | 193776 ms | 2249 ms
|
SelectCategoryToSellItem | 0 % | 1789 | 0 | 4 ms | 283553 ms | 2654 ms
|
SellItemForm | 0 % | 1733 | 0 | 2 ms | 285059 ms | 3643 ms
|
RegisterItem | 0 % | 1688 | 0 | 4 ms | 283427 ms | 3238 ms
|
AboutMe (auth form) | 1 % | 5585 | 0 | 0 ms | 283484 ms | 2882 ms
|
AboutMe | 2 % | 9158 | 0 | 4 ms | 284440 ms | 2861 ms
|
Back probability | 9 % | 30227 | 0 | 0 ms | 0 ms | 0 ms
|
End of Session | 1 % | 4182 | 0 | 0 ms | 0 ms | 0 ms
|
Total | 100 % | 311378 | 2763 | - | - | 2502 ms
|
Average throughput | 523 req/s
| |||||
Completed sessions | 4181
| |||||
Total time | 984525 seconds
| |||||
Average session time | 235 seconds
| |||||
An error occured while waiting for remote processes termination (Skipping waits)
Command is: /usr/bin/scp farm6.csail.mit.edu:/tmp/client1 /home/drkp/sandbox/txcache/src/RUBiS-1.4.3/bench/2009-3-20@2:59:42//client1.bin
Command is: /usr/bin/ssh -x localhost /bin/bash -c 'LANG=en_GB.UTF-8 /usr/bin/sar -n DEV -n SOCK -rubcw 1 605 -f /home/drkp/sandbox/txcache/src/RUBiS-1.4.3/bench/2009-3-20@2:59:42//client1.bin > /home/drkp/sandbox/txcache/src/RUBiS-1.4.3/bench/2009-3-20@2:59:42//client1'
Command is: /usr/bin/scp farm14:/tmp/db_server0 /home/drkp/sandbox/txcache/src/RUBiS-1.4.3/bench/2009-3-20@2:59:42//db_server0.bin
Command is: /usr/bin/ssh -x localhost /bin/bash -c 'LANG=en_GB.UTF-8 /usr/bin/sar -n DEV -n SOCK -rubcw 1 605 -f /home/drkp/sandbox/txcache/src/RUBiS-1.4.3/bench/2009-3-20@2:59:42//db_server0.bin > /home/drkp/sandbox/txcache/src/RUBiS-1.4.3/bench/2009-3-20@2:59:42//db_server0'
Command is: /usr/bin/scp farm12.csail.mit.edu:/tmp/web_server0 /home/drkp/sandbox/txcache/src/RUBiS-1.4.3/bench/2009-3-20@2:59:42//web_server0.bin
Command is: /usr/bin/ssh -x localhost /bin/bash -c 'LANG=en_GB.UTF-8 /usr/bin/sar -n DEV -n SOCK -rubcw 1 605 -f /home/drkp/sandbox/txcache/src/RUBiS-1.4.3/bench/2009-3-20@2:59:42//web_server0.bin > /home/drkp/sandbox/txcache/src/RUBiS-1.4.3/bench/2009-3-20@2:59:42//web_server0'
Command is: /usr/bin/scp farm13.csail.mit.edu:/tmp/web_server1 /home/drkp/sandbox/txcache/src/RUBiS-1.4.3/bench/2009-3-20@2:59:42//web_server1.bin
Command is: /usr/bin/ssh -x localhost /bin/bash -c 'LANG=en_GB.UTF-8 /usr/bin/sar -n DEV -n SOCK -rubcw 1 605 -f /home/drkp/sandbox/txcache/src/RUBiS-1.4.3/bench/2009-3-20@2:59:42//web_server1.bin > /home/drkp/sandbox/txcache/src/RUBiS-1.4.3/bench/2009-3-20@2:59:42//web_server1'
Command is: /usr/bin/scp localhost:/tmp/client0 /home/drkp/sandbox/txcache/src/RUBiS-1.4.3/bench/2009-3-20@2:59:42//client0.bin
Command is: /usr/bin/ssh -x localhost /bin/bash -c 'LANG=en_GB.UTF-8 /usr/bin/sar -n DEV -n SOCK -rubcw 1 605 -f /home/drkp/sandbox/txcache/src/RUBiS-1.4.3/bench/2009-3-20@2:59:42//client0.bin > /home/drkp/sandbox/txcache/src/RUBiS-1.4.3/bench/2009-3-20@2:59:42//client0'
Command is: /usr/bin/scp farm6.csail.mit.edu:/tmp/trace_client1.html /home/drkp/sandbox/txcache/src/RUBiS-1.4.3/bench/2009-3-20@2:59:42//
Command is: /usr/bin/scp farm6.csail.mit.edu:/tmp/stat_client1.html /home/drkp/sandbox/txcache/src/RUBiS-1.4.3/bench/2009-3-20@2:59:42//
|
|
|
|
|
|
 | 
|
 | 
|
 | 
|
 | 
|
 | 
|
 | 
|
 | 
|
 | 
|
 | 
|