Node information
Test timing information
Up ramp statistics
Runtime session statistics
Down ramp statistics
Overall statistics
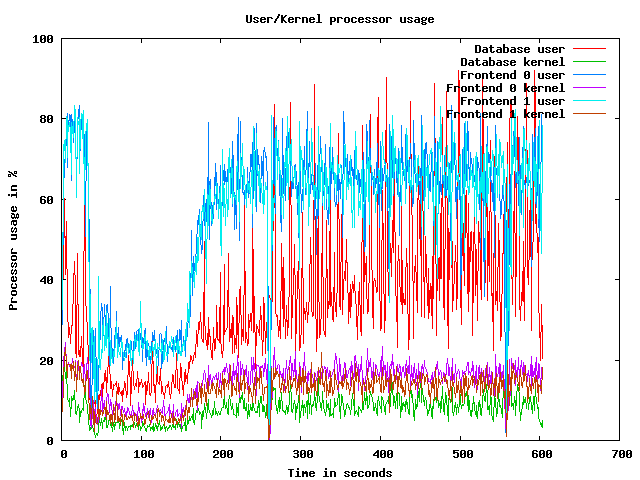
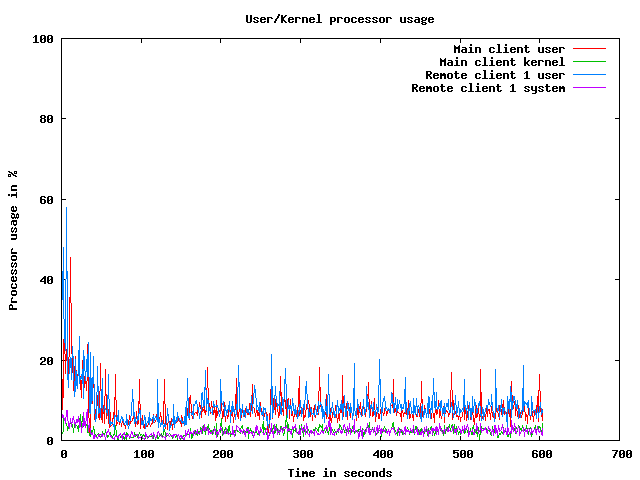
CPU usage graphs
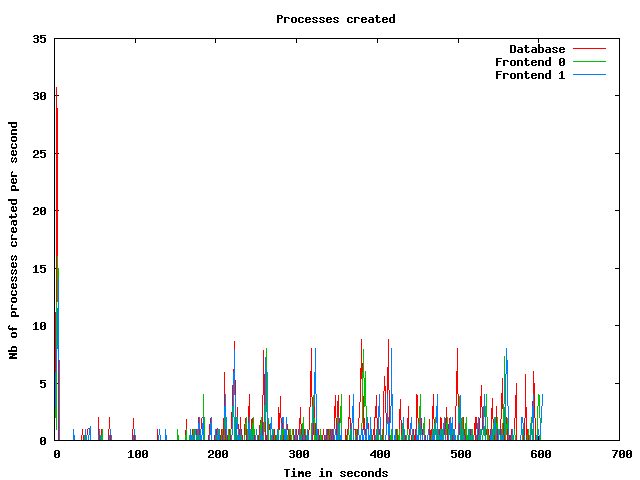
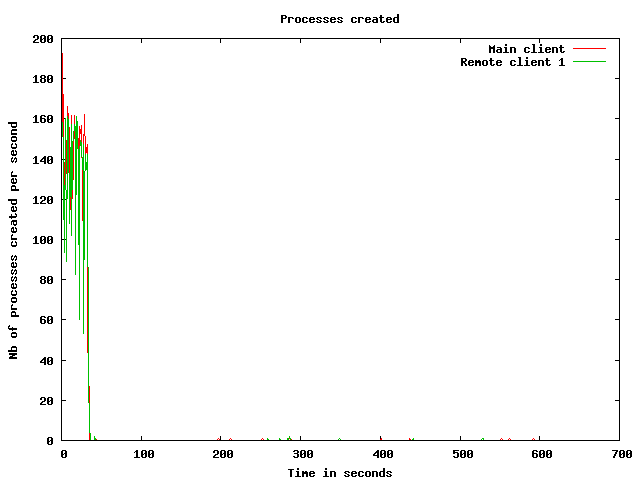
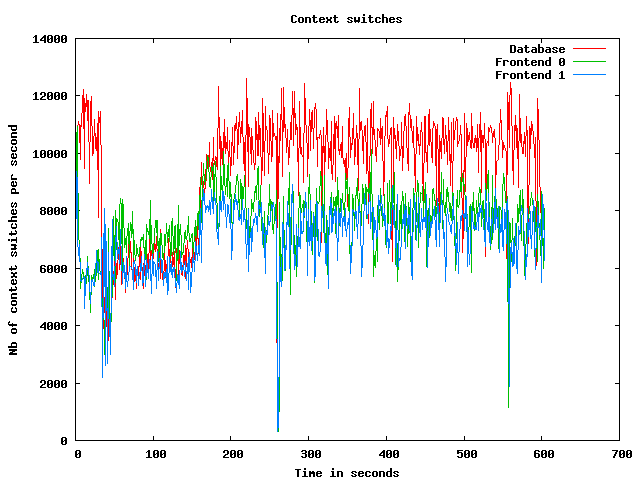
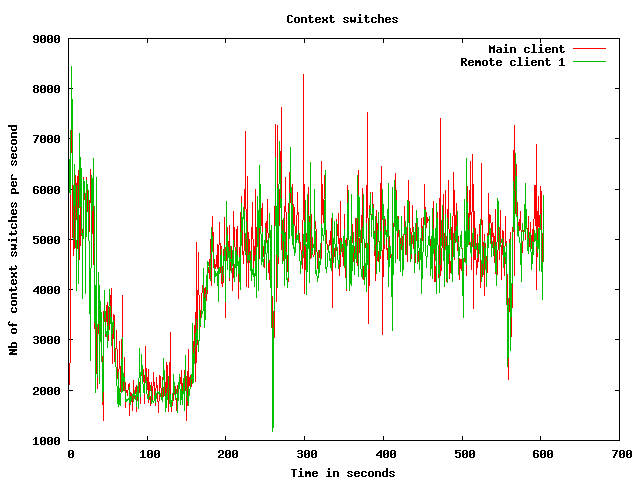
Processes usage graphs
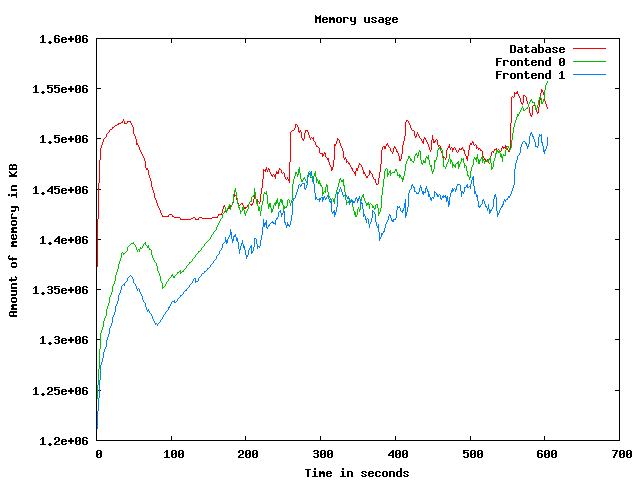
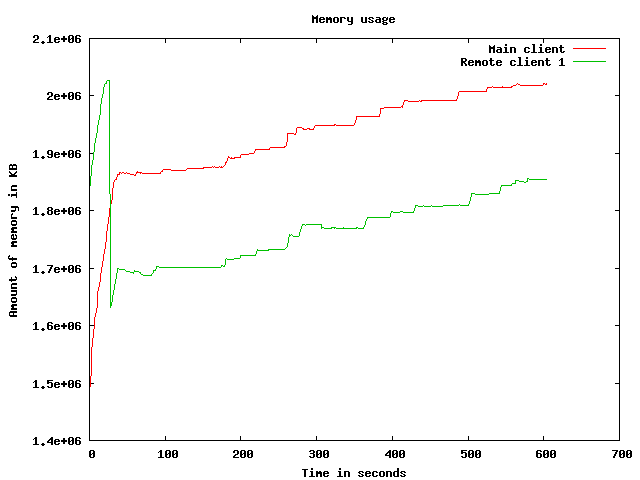
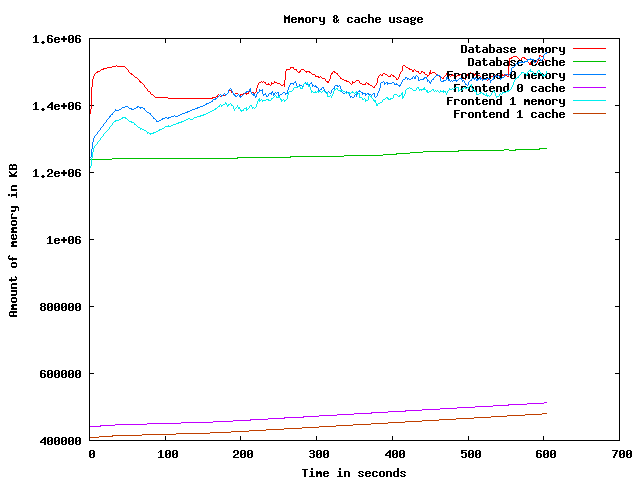
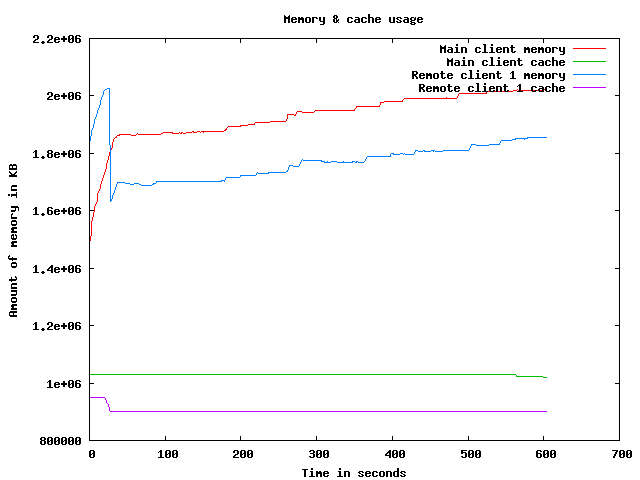
Memory usage graph
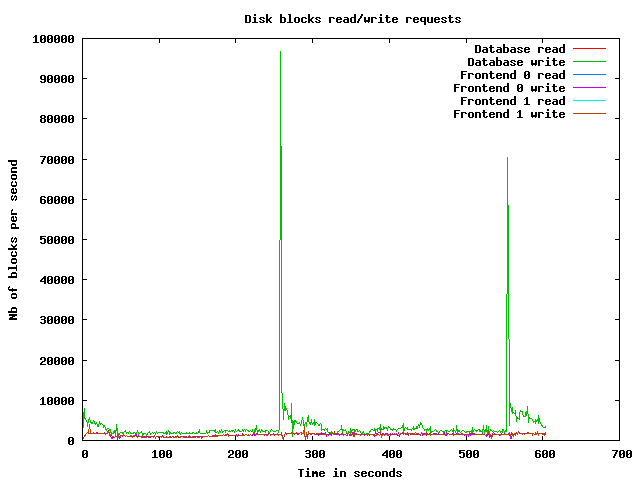
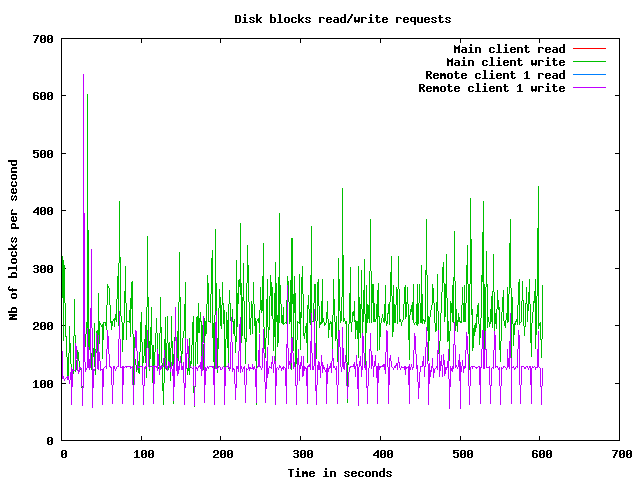
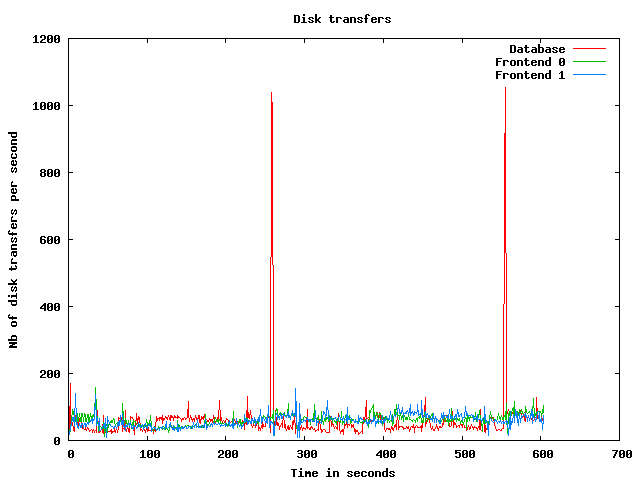
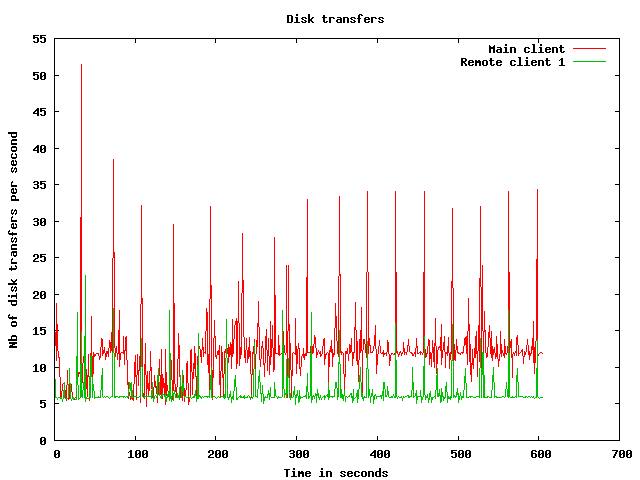
Disk usage graphs
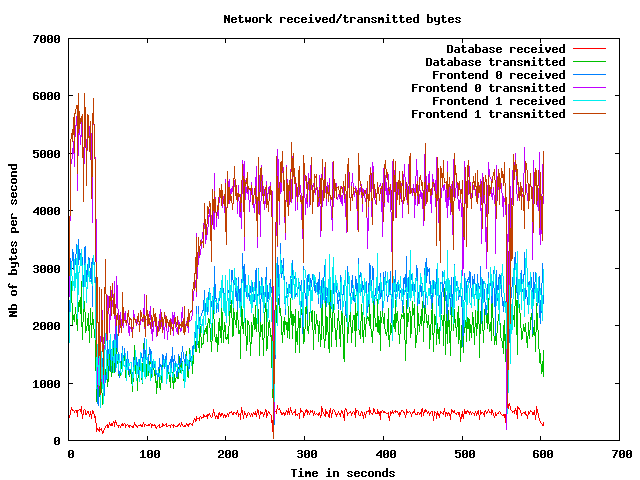
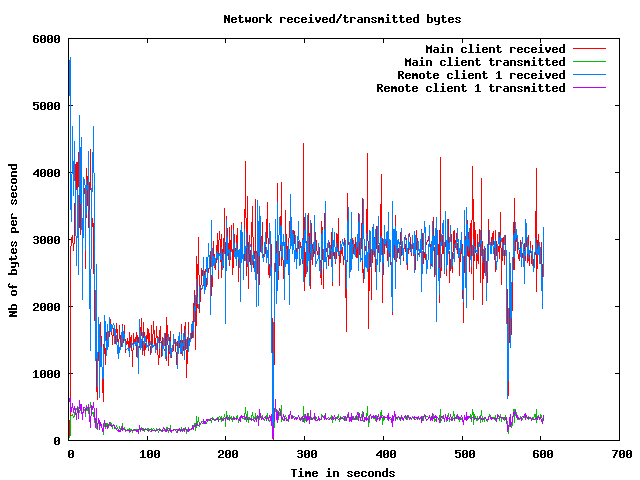
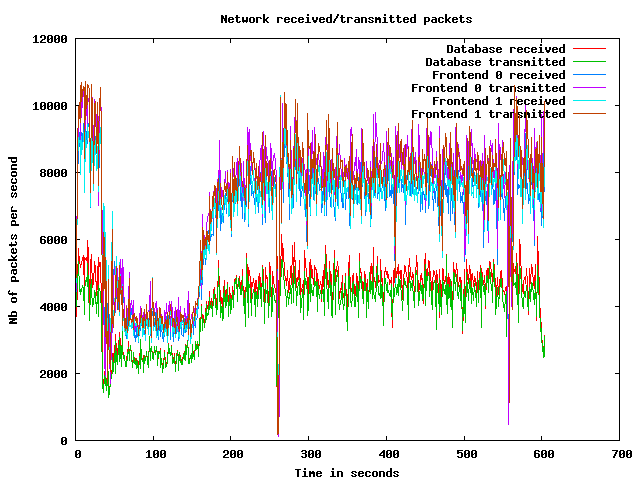
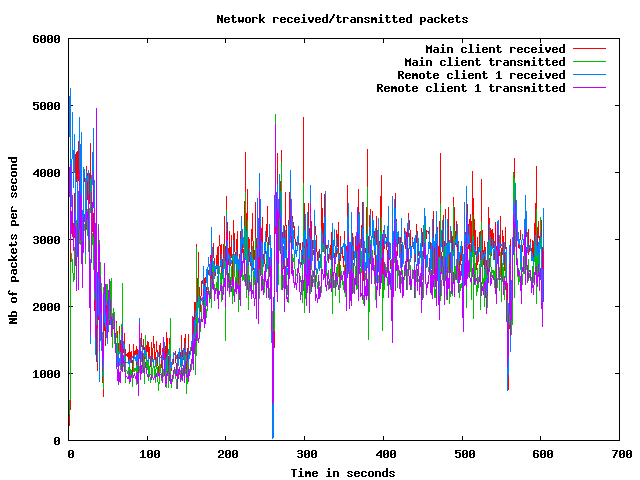
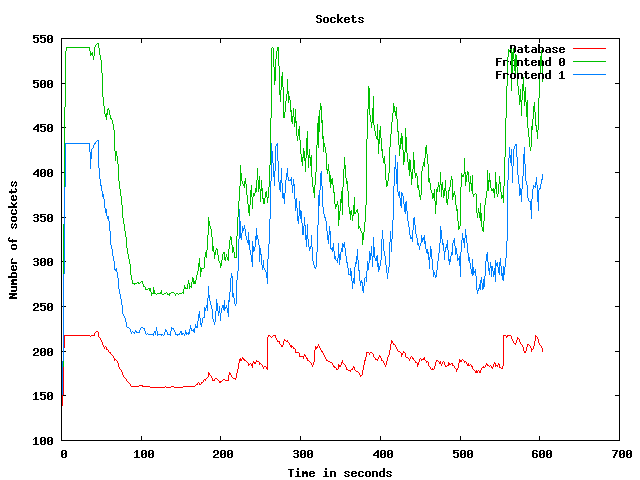
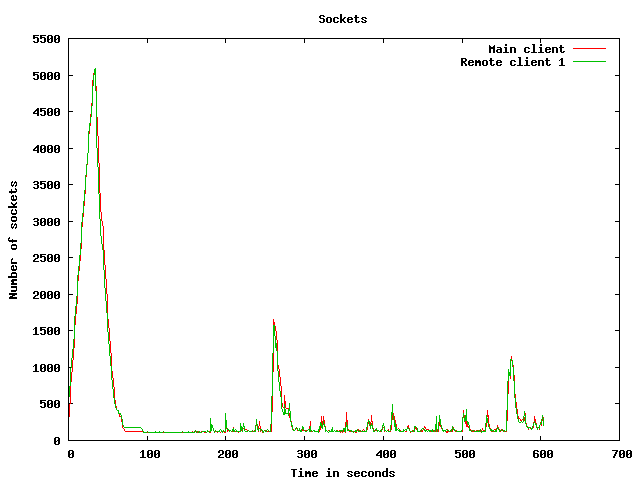
Network usage graphs
| Test start | 2009-3-20 4:7:42 |
| Up ramp start | 2009-3-20 4:8:18 |
| Runtime session start | 2009-3-20 4:10:18 |
| Down ramp start | 2009-3-20 4:17:48 |
| Test end | 2009-3-20 4:20:23 |
| Up ramp length | 2 minutes 0 millisecond (requested 120000 ms) |
| Runtime session length | 7 minutes 30 seconds 1 millisecond (requested 450000 ms) |
| Down ramp length | 30 seconds 0 millisecond (requested 30000 ms) |
| Total test length | 12 minutes 41 seconds 369 milliseconds |
| State name | % of total | Count | Errors | Minimum Time | Maximum Time | Average Time |
|---|---|---|---|---|---|---|
Home | 9 % | 8123 | 0 | 0 ms | 93005 ms | 4929 ms
|
Register | 1 % | 1185 | 0 | 0 ms | 45534 ms | 2050 ms
|
RegisterUser | 1 % | 1102 | 22 | 4 ms | 59118 ms | 1575 ms
|
Browse | 9 % | 8252 | 0 | 0 ms | 59140 ms | 2222 ms
|
BrowseCategories | 6 % | 5466 | 0 | 3 ms | 45635 ms | 1816 ms
|
SearchItemsInCategory | 14 % | 12704 | 0 | 3 ms | 56100 ms | 1426 ms
|
BrowseRegions | 2 % | 2330 | 0 | 3 ms | 45612 ms | 1954 ms
|
BrowseCategoriesInRegion | 2 % | 2176 | 0 | 3 ms | 45456 ms | 1448 ms
|
SearchItemsInRegion | 5 % | 4369 | 0 | 0 ms | 45804 ms | 1385 ms
|
ViewItem | 12 % | 10804 | 0 | 3 ms | 59271 ms | 1451 ms
|
ViewUserInfo | 2 % | 1881 | 0 | 3 ms | 45079 ms | 1201 ms
|
ViewBidHistory | 1 % | 1010 | 0 | 3 ms | 45158 ms | 1365 ms
|
BuyNowAuth | 1 % | 936 | 0 | 2 ms | 45606 ms | 1639 ms
|
BuyNow | 0 % | 856 | 118 | 5 ms | 49599 ms | 1121 ms
|
StoreBuyBow | 0 % | 654 | 0 | 4 ms | 45233 ms | 940 ms
|
PutBidAuth | 4 % | 3787 | 0 | 0 ms | 45722 ms | 1403 ms
|
PutBid | 4 % | 3751 | 522 | 3 ms | 49602 ms | 1180 ms
|
StoreBid | 2 % | 2208 | 1 | 4 ms | 45458 ms | 1306 ms
|
PutCommentAuth | 0 % | 0 | 0 | 0 ms | 0 ms | 0 ms
|
PutComment | 0 % | 311 | 29 | 4 ms | 45760 ms | 1191 ms
|
StoreComment | 0 % | 259 | 0 | 4 ms | 45014 ms | 2007 ms
|
Sell | 0 % | 622 | 0 | 0 ms | 45757 ms | 2098 ms
|
SelectCategoryToSellItem | 0 % | 586 | 0 | 3 ms | 45522 ms | 1972 ms
|
SellItemForm | 0 % | 541 | 0 | 2 ms | 45610 ms | 1683 ms
|
RegisterItem | 0 % | 506 | 0 | 4 ms | 45584 ms | 1817 ms
|
AboutMe (auth form) | 2 % | 1917 | 0 | 0 ms | 49601 ms | 2317 ms
|
AboutMe | 3 % | 2700 | 0 | 4 ms | 59137 ms | 1784 ms
|
Back probability | 7 % | 6734 | 0 | 0 ms | 0 ms | 0 ms
|
End of Session | 1 % | 952 | 0 | 0 ms | 0 ms | 0 ms
|
Total | 100 % | 86722 | 692 | - | - | 1760 ms
|
Average throughput | 728 req/s
| |||||
Completed sessions | 873
| |||||
Total time | 46665 seconds
| |||||
Average session time | 53 seconds
| |||||
| State name | % of total | Count | Errors | Minimum Time | Maximum Time | Average Time |
|---|---|---|---|---|---|---|
Home | 4 % | 15856 | 0 | 0 ms | 22670 ms | 46 ms
|
Register | 1 % | 3810 | 0 | 0 ms | 21671 ms | 108 ms
|
RegisterUser | 1 % | 3740 | 86 | 5 ms | 21989 ms | 169 ms
|
Browse | 7 % | 25505 | 0 | 0 ms | 45011 ms | 111 ms
|
BrowseCategories | 4 % | 17733 | 0 | 3 ms | 45034 ms | 134 ms
|
SearchItemsInCategory | 15 % | 55753 | 0 | 1 ms | 45018 ms | 135 ms
|
BrowseRegions | 2 % | 7474 | 0 | 3 ms | 21759 ms | 108 ms
|
BrowseCategoriesInRegion | 2 % | 7351 | 0 | 3 ms | 21818 ms | 149 ms
|
SearchItemsInRegion | 5 % | 18642 | 0 | 0 ms | 22861 ms | 155 ms
|
ViewItem | 14 % | 51621 | 0 | 3 ms | 45053 ms | 132 ms
|
ViewUserInfo | 3 % | 11937 | 0 | 3 ms | 21957 ms | 139 ms
|
ViewBidHistory | 1 % | 6153 | 0 | 3 ms | 45031 ms | 189 ms
|
BuyNowAuth | 1 % | 4913 | 0 | 2 ms | 21792 ms | 123 ms
|
BuyNow | 1 % | 4802 | 733 | 4 ms | 21864 ms | 153 ms
|
StoreBuyBow | 1 % | 4026 | 3 | 4 ms | 21645 ms | 106 ms
|
PutBidAuth | 4 % | 17847 | 0 | 0 ms | 22260 ms | 119 ms
|
PutBid | 5 % | 20561 | 2392 | 4 ms | 22886 ms | 153 ms
|
StoreBid | 3 % | 13389 | 11 | 5 ms | 22697 ms | 133 ms
|
PutCommentAuth | 0 % | 0 | 0 | 0 ms | 0 ms | 0 ms
|
PutComment | 0 % | 1767 | 140 | 4 ms | 21226 ms | 128 ms
|
StoreComment | 0 % | 1595 | 0 | 4 ms | 21902 ms | 150 ms
|
Sell | 0 % | 2024 | 0 | 0 ms | 21339 ms | 94 ms
|
SelectCategoryToSellItem | 0 % | 1990 | 0 | 4 ms | 21402 ms | 147 ms
|
SellItemForm | 0 % | 1969 | 0 | 2 ms | 22271 ms | 101 ms
|
RegisterItem | 0 % | 1930 | 0 | 5 ms | 21865 ms | 165 ms
|
AboutMe (auth form) | 1 % | 6041 | 0 | 0 ms | 21546 ms | 101 ms
|
AboutMe | 2 % | 10500 | 0 | 4 ms | 22401 ms | 170 ms
|
Back probability | 10 % | 38335 | 0 | 0 ms | 0 ms | 0 ms
|
End of Session | 1 % | 5333 | 0 | 0 ms | 0 ms | 0 ms
|
Total | 100 % | 362597 | 3365 | - | - | 114 ms
|
Average throughput | 813 req/s
| |||||
Completed sessions | 5327
| |||||
Total time | 1341327 seconds
| |||||
Average session time | 251 seconds
| |||||
| State name | % of total | Count | Errors | Minimum Time | Maximum Time | Average Time |
|---|---|---|---|---|---|---|
Home | 3 % | 465 | 0 | 0 ms | 3083 ms | 22 ms
|
Register | 1 % | 155 | 0 | 0 ms | 45281 ms | 606 ms
|
RegisterUser | 1 % | 156 | 2 | 5 ms | 45320 ms | 308 ms
|
Browse | 7 % | 866 | 0 | 0 ms | 45259 ms | 218 ms
|
BrowseCategories | 4 % | 562 | 0 | 3 ms | 45489 ms | 346 ms
|
SearchItemsInCategory | 15 % | 1876 | 0 | 3 ms | 45481 ms | 181 ms
|
BrowseRegions | 1 % | 244 | 0 | 3 ms | 45323 ms | 397 ms
|
BrowseCategoriesInRegion | 1 % | 242 | 0 | 3 ms | 45444 ms | 200 ms
|
SearchItemsInRegion | 4 % | 611 | 0 | 0 ms | 45394 ms | 104 ms
|
ViewItem | 14 % | 1745 | 0 | 3 ms | 45289 ms | 150 ms
|
ViewUserInfo | 3 % | 424 | 0 | 3 ms | 3124 ms | 39 ms
|
ViewBidHistory | 1 % | 204 | 0 | 3 ms | 3044 ms | 51 ms
|
BuyNowAuth | 1 % | 145 | 0 | 2 ms | 45284 ms | 656 ms
|
BuyNow | 1 % | 166 | 18 | 4 ms | 134 ms | 18 ms
|
StoreBuyBow | 0 % | 122 | 0 | 4 ms | 3205 ms | 92 ms
|
PutBidAuth | 5 % | 620 | 0 | 0 ms | 45416 ms | 521 ms
|
PutBid | 5 % | 706 | 71 | 4 ms | 45397 ms | 292 ms
|
StoreBid | 3 % | 476 | 0 | 5 ms | 45106 ms | 219 ms
|
PutCommentAuth | 0 % | 0 | 0 | 0 ms | 0 ms | 0 ms
|
PutComment | 0 % | 59 | 1 | 4 ms | 3168 ms | 88 ms
|
StoreComment | 0 % | 56 | 0 | 5 ms | 45141 ms | 817 ms
|
Sell | 0 % | 75 | 0 | 0 ms | 46 ms | 2 ms
|
SelectCategoryToSellItem | 0 % | 76 | 0 | 4 ms | 3034 ms | 52 ms
|
SellItemForm | 0 % | 65 | 0 | 2 ms | 190 ms | 8 ms
|
RegisterItem | 0 % | 71 | 0 | 4 ms | 76 ms | 14 ms
|
AboutMe (auth form) | 1 % | 191 | 0 | 0 ms | 45168 ms | 256 ms
|
AboutMe | 2 % | 339 | 0 | 4 ms | 3259 ms | 51 ms
|
Back probability | 10 % | 1335 | 0 | 0 ms | 0 ms | 0 ms
|
End of Session | 1 % | 173 | 0 | 0 ms | 0 ms | 0 ms
|
Total | 100 % | 12225 | 92 | - | - | 182 ms
|
Average throughput | 410 req/s
| |||||
Completed sessions | 169
| |||||
Total time | 55642 seconds
| |||||
Average session time | 329 seconds
| |||||
| State name | % of total | Count | Errors | Minimum Time | Maximum Time | Average Time |
|---|---|---|---|---|---|---|
Home | 5 % | 24444 | 0 | 0 ms | 93005 ms | 1668 ms
|
Register | 1 % | 5150 | 0 | 0 ms | 45534 ms | 570 ms
|
RegisterUser | 1 % | 4998 | 110 | 4 ms | 59118 ms | 483 ms
|
Browse | 7 % | 34623 | 0 | 0 ms | 59140 ms | 616 ms
|
BrowseCategories | 5 % | 23762 | 0 | 3 ms | 45635 ms | 526 ms
|
SearchItemsInCategory | 15 % | 70639 | 0 | 1 ms | 56100 ms | 368 ms
|
BrowseRegions | 2 % | 10048 | 0 | 3 ms | 45612 ms | 543 ms
|
BrowseCategoriesInRegion | 2 % | 9769 | 0 | 3 ms | 45456 ms | 439 ms
|
SearchItemsInRegion | 5 % | 23690 | 0 | 0 ms | 45804 ms | 380 ms
|
ViewItem | 13 % | 64263 | 0 | 3 ms | 59271 ms | 354 ms
|
ViewUserInfo | 3 % | 14282 | 0 | 3 ms | 45079 ms | 276 ms
|
ViewBidHistory | 1 % | 7383 | 0 | 3 ms | 45158 ms | 345 ms
|
BuyNowAuth | 1 % | 5994 | 0 | 2 ms | 45606 ms | 373 ms
|
BuyNow | 1 % | 5824 | 869 | 4 ms | 49599 ms | 292 ms
|
StoreBuyBow | 1 % | 4802 | 3 | 4 ms | 45233 ms | 219 ms
|
PutBidAuth | 4 % | 22254 | 0 | 0 ms | 45722 ms | 349 ms
|
PutBid | 5 % | 25070 | 2985 | 3 ms | 49602 ms | 310 ms
|
StoreBid | 3 % | 16073 | 12 | 4 ms | 45458 ms | 297 ms
|
PutCommentAuth | 0 % | 0 | 0 | 0 ms | 0 ms | 0 ms
|
PutComment | 0 % | 2137 | 170 | 4 ms | 45760 ms | 282 ms
|
StoreComment | 0 % | 1910 | 0 | 4 ms | 45141 ms | 421 ms
|
Sell | 0 % | 2721 | 0 | 0 ms | 45757 ms | 550 ms
|
SelectCategoryToSellItem | 0 % | 2652 | 0 | 3 ms | 45522 ms | 547 ms
|
SellItemForm | 0 % | 2575 | 0 | 2 ms | 45610 ms | 431 ms
|
RegisterItem | 0 % | 2507 | 0 | 4 ms | 45584 ms | 494 ms
|
AboutMe (auth form) | 1 % | 8149 | 0 | 0 ms | 49601 ms | 626 ms
|
AboutMe | 2 % | 13608 | 0 | 4 ms | 59137 ms | 487 ms
|
Back probability | 10 % | 46406 | 0 | 0 ms | 0 ms | 0 ms
|
End of Session | 1 % | 6458 | 0 | 0 ms | 0 ms | 0 ms
|
Total | 100 % | 462191 | 4149 | - | - | 424 ms
|
Average throughput | 777 req/s
| |||||
Completed sessions | 6458
| |||||
Total time | 1475443 seconds
| |||||
Average session time | 228 seconds
| |||||
An error occured while waiting for remote processes termination (Skipping waits)
Command is: /usr/bin/scp farm6.csail.mit.edu:/tmp/client1 /home/drkp/sandbox/txcache/src/RUBiS-1.4.3/bench/2009-3-20@4:7:42//client1.bin
Command is: /usr/bin/ssh -x localhost /bin/bash -c 'LANG=en_GB.UTF-8 /usr/bin/sar -n DEV -n SOCK -rubcw 1 605 -f /home/drkp/sandbox/txcache/src/RUBiS-1.4.3/bench/2009-3-20@4:7:42//client1.bin > /home/drkp/sandbox/txcache/src/RUBiS-1.4.3/bench/2009-3-20@4:7:42//client1'
Command is: /usr/bin/scp farm14:/tmp/db_server0 /home/drkp/sandbox/txcache/src/RUBiS-1.4.3/bench/2009-3-20@4:7:42//db_server0.bin
Command is: /usr/bin/ssh -x localhost /bin/bash -c 'LANG=en_GB.UTF-8 /usr/bin/sar -n DEV -n SOCK -rubcw 1 605 -f /home/drkp/sandbox/txcache/src/RUBiS-1.4.3/bench/2009-3-20@4:7:42//db_server0.bin > /home/drkp/sandbox/txcache/src/RUBiS-1.4.3/bench/2009-3-20@4:7:42//db_server0'
Command is: /usr/bin/scp farm12.csail.mit.edu:/tmp/web_server0 /home/drkp/sandbox/txcache/src/RUBiS-1.4.3/bench/2009-3-20@4:7:42//web_server0.bin
Command is: /usr/bin/ssh -x localhost /bin/bash -c 'LANG=en_GB.UTF-8 /usr/bin/sar -n DEV -n SOCK -rubcw 1 605 -f /home/drkp/sandbox/txcache/src/RUBiS-1.4.3/bench/2009-3-20@4:7:42//web_server0.bin > /home/drkp/sandbox/txcache/src/RUBiS-1.4.3/bench/2009-3-20@4:7:42//web_server0'
Command is: /usr/bin/scp farm13.csail.mit.edu:/tmp/web_server1 /home/drkp/sandbox/txcache/src/RUBiS-1.4.3/bench/2009-3-20@4:7:42//web_server1.bin
Command is: /usr/bin/ssh -x localhost /bin/bash -c 'LANG=en_GB.UTF-8 /usr/bin/sar -n DEV -n SOCK -rubcw 1 605 -f /home/drkp/sandbox/txcache/src/RUBiS-1.4.3/bench/2009-3-20@4:7:42//web_server1.bin > /home/drkp/sandbox/txcache/src/RUBiS-1.4.3/bench/2009-3-20@4:7:42//web_server1'
Command is: /usr/bin/scp localhost:/tmp/client0 /home/drkp/sandbox/txcache/src/RUBiS-1.4.3/bench/2009-3-20@4:7:42//client0.bin
Command is: /usr/bin/ssh -x localhost /bin/bash -c 'LANG=en_GB.UTF-8 /usr/bin/sar -n DEV -n SOCK -rubcw 1 605 -f /home/drkp/sandbox/txcache/src/RUBiS-1.4.3/bench/2009-3-20@4:7:42//client0.bin > /home/drkp/sandbox/txcache/src/RUBiS-1.4.3/bench/2009-3-20@4:7:42//client0'
Command is: /usr/bin/scp farm6.csail.mit.edu:/tmp/trace_client1.html /home/drkp/sandbox/txcache/src/RUBiS-1.4.3/bench/2009-3-20@4:7:42//
Command is: /usr/bin/scp farm6.csail.mit.edu:/tmp/stat_client1.html /home/drkp/sandbox/txcache/src/RUBiS-1.4.3/bench/2009-3-20@4:7:42//
|
|
|
|
|
|
 | 
|
 | 
|
 | 
|
 | 
|
 | 
|
 | 
|
 | 
|
 | 
|
 | 
|