Node information
Test timing information
Up ramp statistics
Runtime session statistics
Down ramp statistics
Overall statistics
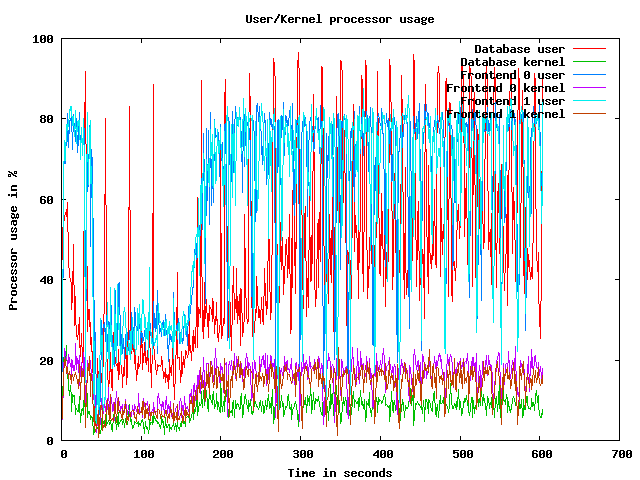
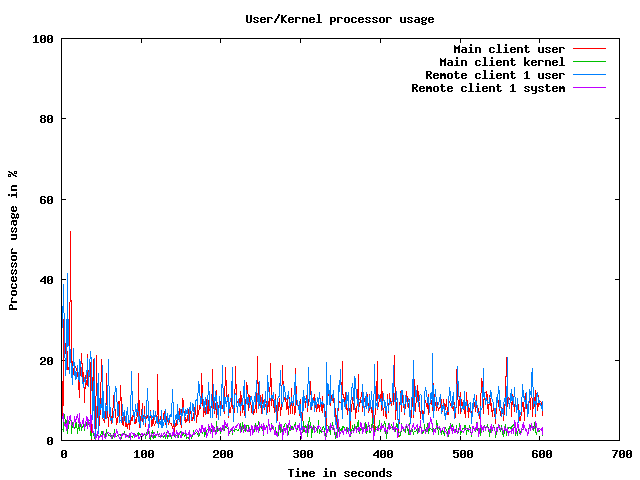
CPU usage graphs
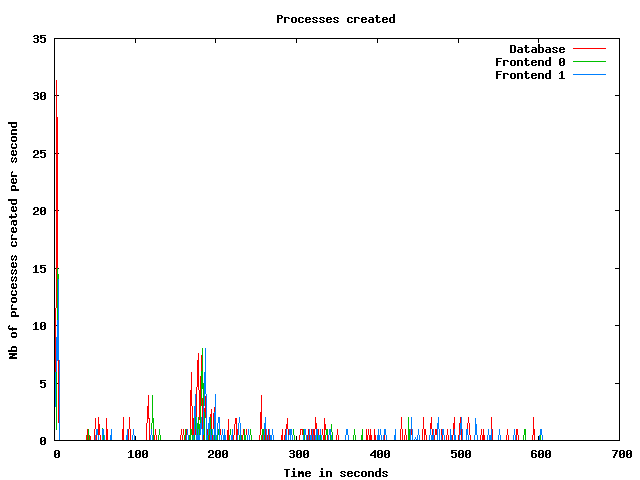
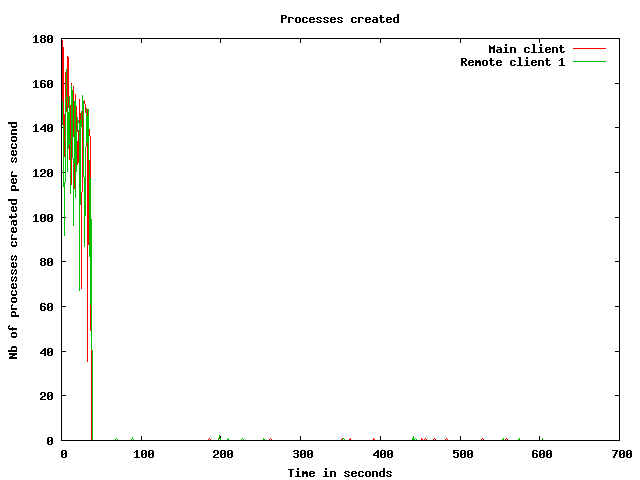
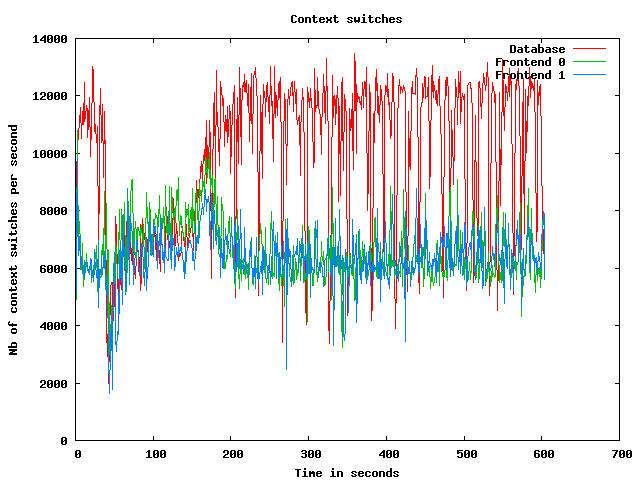
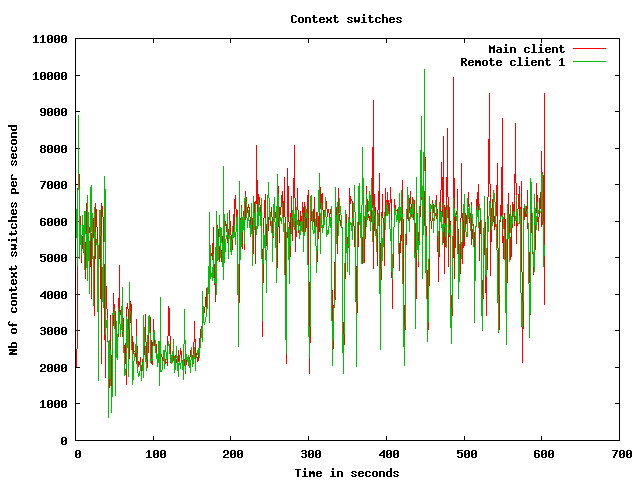
Processes usage graphs
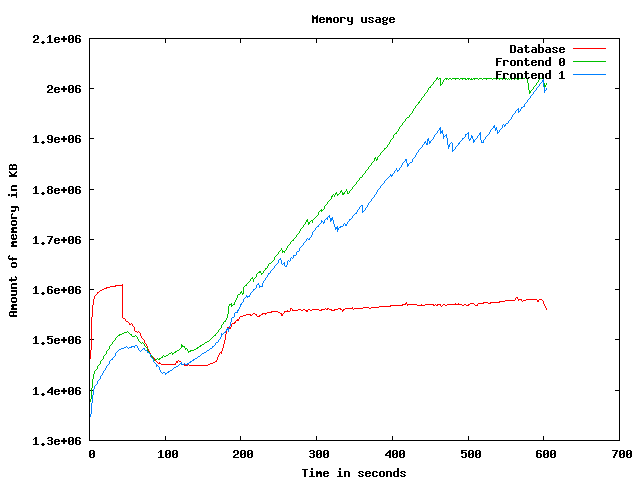
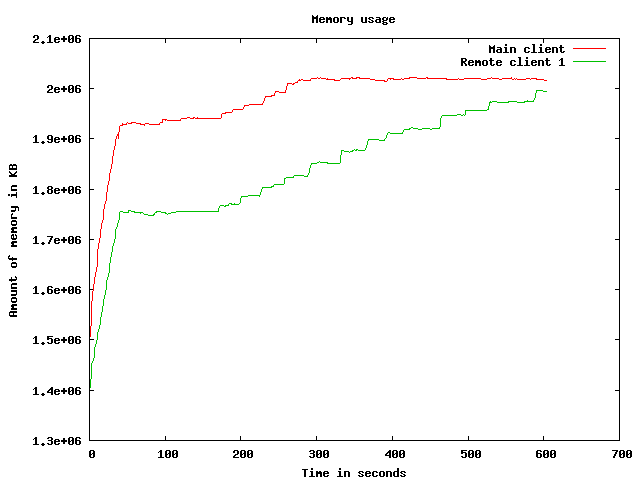
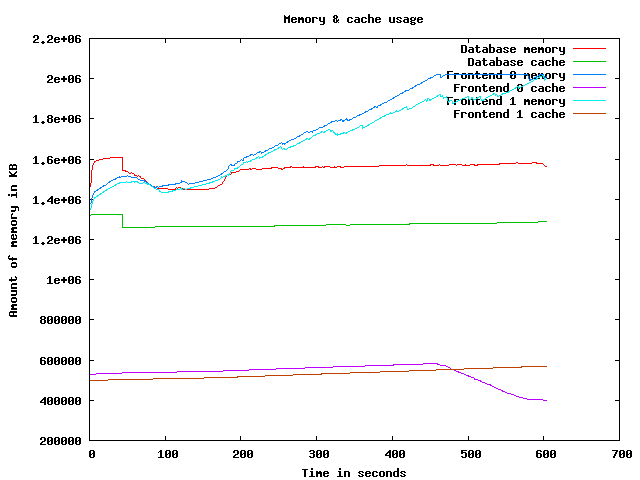
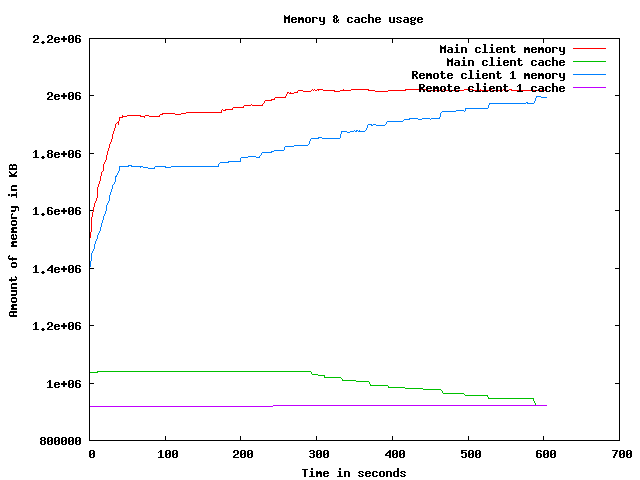
Memory usage graph
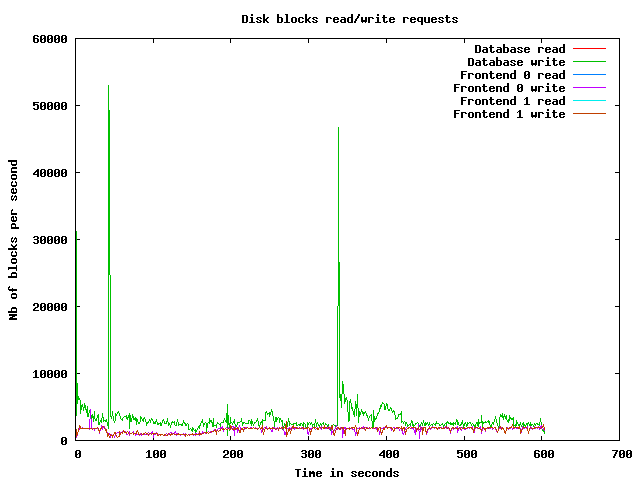
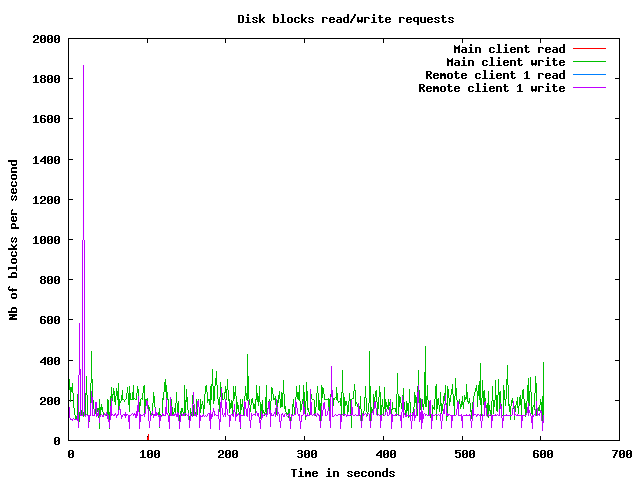
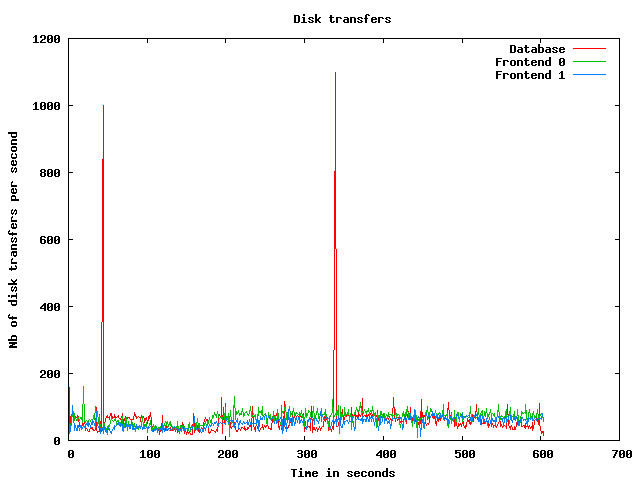
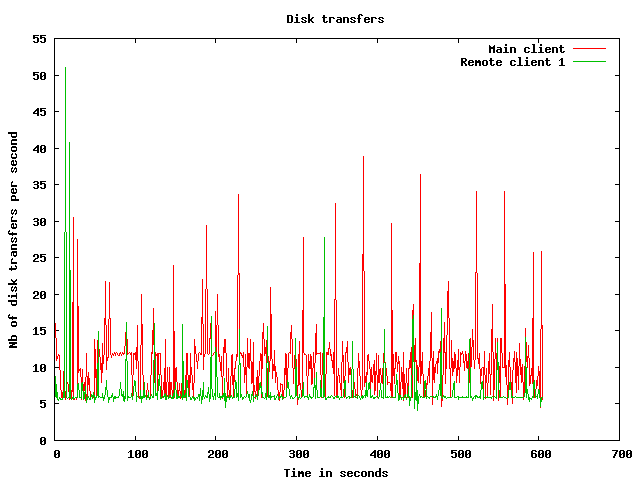
Disk usage graphs
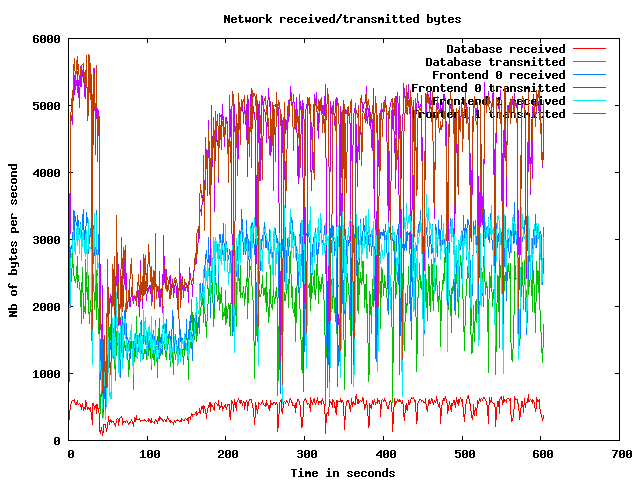
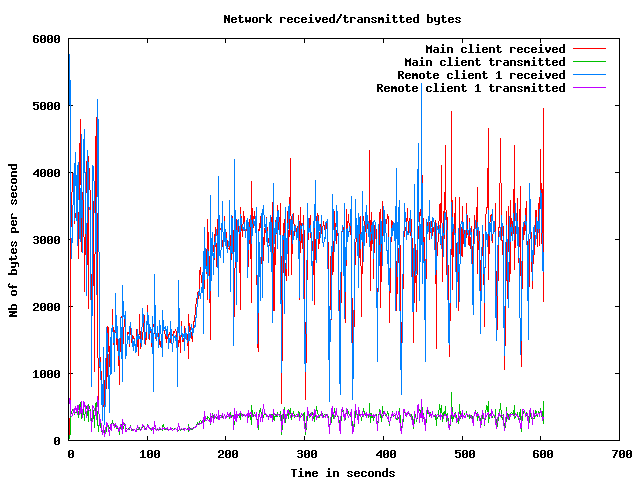
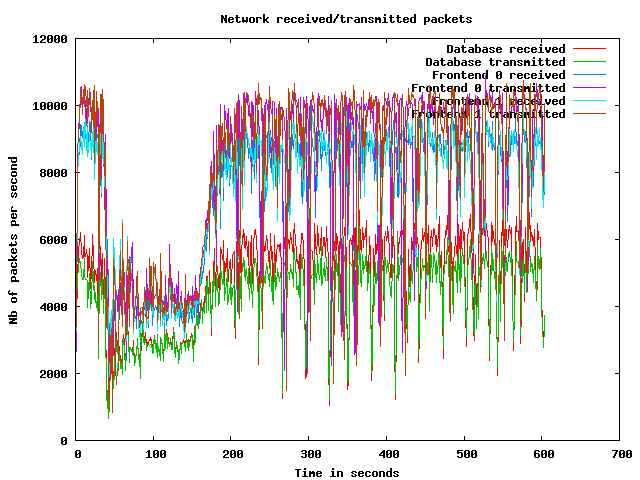
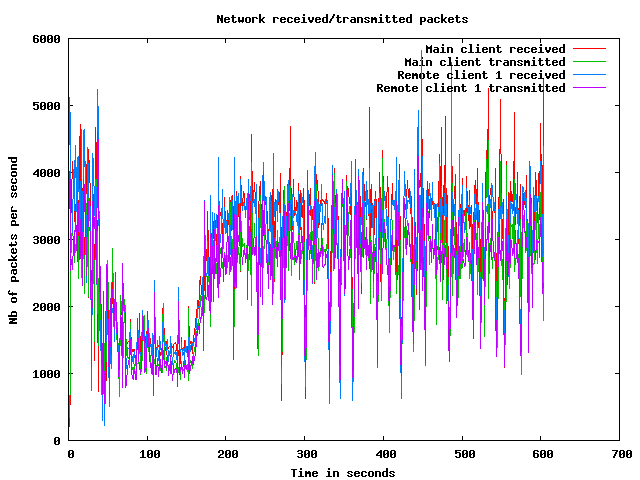
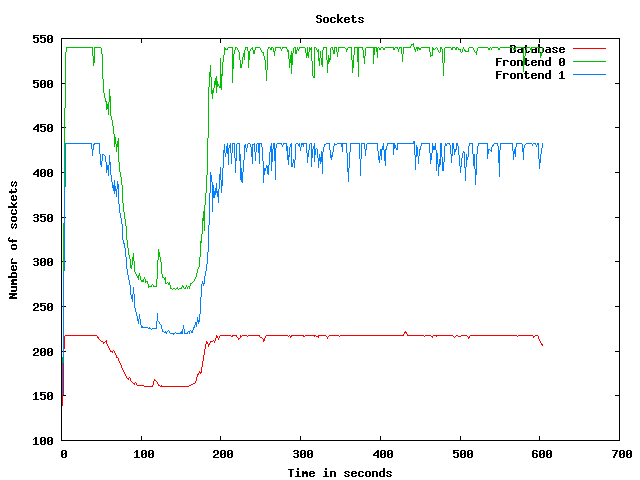
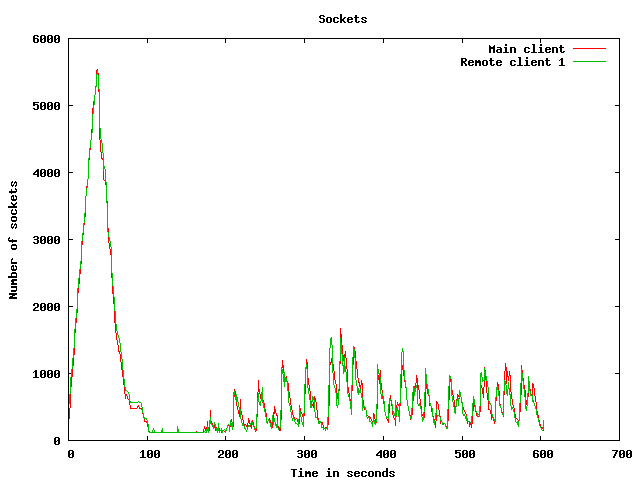
Network usage graphs
| Test start | 2009-3-20 4:21:17 |
| Up ramp start | 2009-3-20 4:21:56 |
| Runtime session start | 2009-3-20 4:23:56 |
| Down ramp start | 2009-3-20 4:31:26 |
| Test end | 2009-3-20 4:34:9 |
| Up ramp length | 2 minutes 1 millisecond (requested 120000 ms) |
| Runtime session length | 7 minutes 30 seconds 0 millisecond (requested 450000 ms) |
| Down ramp length | 30 seconds 0 millisecond (requested 30000 ms) |
| Total test length | 12 minutes 52 seconds 357 milliseconds |
| State name | % of total | Count | Errors | Minimum Time | Maximum Time | Average Time |
|---|---|---|---|---|---|---|
Home | 9 % | 8679 | 0 | 0 ms | 93433 ms | 6355 ms
|
Register | 1 % | 1296 | 0 | 0 ms | 93051 ms | 2507 ms
|
RegisterUser | 1 % | 1212 | 34 | 5 ms | 93034 ms | 2347 ms
|
Browse | 9 % | 8838 | 0 | 0 ms | 93486 ms | 2847 ms
|
BrowseCategories | 6 % | 5871 | 0 | 3 ms | 93736 ms | 2241 ms
|
SearchItemsInCategory | 14 % | 13664 | 0 | 3 ms | 93048 ms | 1790 ms
|
BrowseRegions | 2 % | 2434 | 0 | 3 ms | 93063 ms | 2252 ms
|
BrowseCategoriesInRegion | 2 % | 2280 | 0 | 3 ms | 93719 ms | 2431 ms
|
SearchItemsInRegion | 4 % | 4626 | 0 | 0 ms | 93475 ms | 1747 ms
|
ViewItem | 12 % | 11542 | 0 | 3 ms | 93717 ms | 1841 ms
|
ViewUserInfo | 2 % | 2156 | 0 | 3 ms | 93057 ms | 1530 ms
|
ViewBidHistory | 1 % | 1117 | 0 | 3 ms | 93025 ms | 1714 ms
|
BuyNowAuth | 1 % | 1068 | 0 | 2 ms | 93019 ms | 1355 ms
|
BuyNow | 1 % | 953 | 147 | 4 ms | 65097 ms | 1176 ms
|
StoreBuyBow | 0 % | 718 | 0 | 4 ms | 93035 ms | 1717 ms
|
PutBidAuth | 4 % | 3891 | 0 | 0 ms | 93021 ms | 1711 ms
|
PutBid | 4 % | 3858 | 465 | 0 ms | 93025 ms | 1513 ms
|
StoreBid | 2 % | 2267 | 1 | 4 ms | 93017 ms | 1578 ms
|
PutCommentAuth | 0 % | 0 | 0 | 0 ms | 0 ms | 0 ms
|
PutComment | 0 % | 336 | 34 | 3 ms | 45426 ms | 1064 ms
|
StoreComment | 0 % | 273 | 0 | 4 ms | 45301 ms | 1063 ms
|
Sell | 0 % | 700 | 0 | 0 ms | 93020 ms | 2789 ms
|
SelectCategoryToSellItem | 0 % | 666 | 0 | 4 ms | 93020 ms | 2374 ms
|
SellItemForm | 0 % | 629 | 0 | 2 ms | 93001 ms | 2016 ms
|
RegisterItem | 0 % | 590 | 0 | 4 ms | 93044 ms | 2131 ms
|
AboutMe (auth form) | 2 % | 1956 | 0 | 0 ms | 93015 ms | 3224 ms
|
AboutMe | 2 % | 2733 | 0 | 4 ms | 93480 ms | 2190 ms
|
Back probability | 7 % | 7276 | 0 | 0 ms | 0 ms | 0 ms
|
End of Session | 1 % | 1018 | 0 | 0 ms | 0 ms | 0 ms
|
Total | 100 % | 92647 | 681 | - | - | 2234 ms
|
Average throughput | 777 req/s
| |||||
Completed sessions | 925
| |||||
Total time | 51320 seconds
| |||||
Average session time | 55 seconds
| |||||
| State name | % of total | Count | Errors | Minimum Time | Maximum Time | Average Time |
|---|---|---|---|---|---|---|
Home | 4 % | 15819 | 0 | 0 ms | 46327 ms | 222 ms
|
Register | 1 % | 3888 | 0 | 0 ms | 45673 ms | 487 ms
|
RegisterUser | 1 % | 3860 | 126 | 5 ms | 45811 ms | 573 ms
|
Browse | 7 % | 26497 | 0 | 0 ms | 93625 ms | 526 ms
|
BrowseCategories | 4 % | 18583 | 0 | 3 ms | 46273 ms | 578 ms
|
SearchItemsInCategory | 15 % | 58602 | 0 | 3 ms | 192071 ms | 622 ms
|
BrowseRegions | 2 % | 7596 | 0 | 3 ms | 47823 ms | 516 ms
|
BrowseCategoriesInRegion | 1 % | 7458 | 0 | 3 ms | 45784 ms | 571 ms
|
SearchItemsInRegion | 5 % | 19219 | 0 | 0 ms | 190018 ms | 570 ms
|
ViewItem | 14 % | 52997 | 0 | 3 ms | 93560 ms | 560 ms
|
ViewUserInfo | 3 % | 12555 | 0 | 3 ms | 93526 ms | 557 ms
|
ViewBidHistory | 1 % | 6540 | 0 | 3 ms | 45968 ms | 637 ms
|
BuyNowAuth | 1 % | 4987 | 0 | 2 ms | 93784 ms | 574 ms
|
BuyNow | 1 % | 4921 | 669 | 5 ms | 45816 ms | 628 ms
|
StoreBuyBow | 1 % | 4185 | 8 | 5 ms | 45672 ms | 502 ms
|
PutBidAuth | 4 % | 18738 | 0 | 0 ms | 190000 ms | 527 ms
|
PutBid | 5 % | 21633 | 2311 | 4 ms | 93593 ms | 572 ms
|
StoreBid | 3 % | 14324 | 22 | 4 ms | 93540 ms | 564 ms
|
PutCommentAuth | 0 % | 0 | 0 | 0 ms | 0 ms | 0 ms
|
PutComment | 0 % | 1828 | 129 | 5 ms | 45604 ms | 660 ms
|
StoreComment | 0 % | 1663 | 0 | 5 ms | 45584 ms | 579 ms
|
Sell | 0 % | 2147 | 0 | 0 ms | 45453 ms | 526 ms
|
SelectCategoryToSellItem | 0 % | 2105 | 0 | 4 ms | 46150 ms | 557 ms
|
SellItemForm | 0 % | 2056 | 0 | 2 ms | 45734 ms | 558 ms
|
RegisterItem | 0 % | 2013 | 0 | 5 ms | 45941 ms | 707 ms
|
AboutMe (auth form) | 1 % | 6068 | 0 | 0 ms | 93568 ms | 634 ms
|
AboutMe | 2 % | 10246 | 0 | 4 ms | 47935 ms | 597 ms
|
Back probability | 10 % | 39596 | 0 | 0 ms | 0 ms | 0 ms
|
End of Session | 1 % | 5629 | 0 | 0 ms | 0 ms | 0 ms
|
Total | 100 % | 375753 | 3265 | - | - | 486 ms
|
Average throughput | 842 req/s
| |||||
Completed sessions | 5613
| |||||
Total time | 1447526 seconds
| |||||
Average session time | 257 seconds
| |||||
| State name | % of total | Count | Errors | Minimum Time | Maximum Time | Average Time |
|---|---|---|---|---|---|---|
Home | 4 % | 558 | 0 | 0 ms | 45008 ms | 89 ms
|
Register | 0 % | 131 | 0 | 0 ms | 3105 ms | 28 ms
|
RegisterUser | 0 % | 127 | 4 | 5 ms | 3441 ms | 55 ms
|
Browse | 7 % | 942 | 0 | 0 ms | 93001 ms | 252 ms
|
BrowseCategories | 4 % | 668 | 0 | 3 ms | 3570 ms | 27 ms
|
SearchItemsInCategory | 15 % | 2091 | 0 | 3 ms | 93004 ms | 134 ms
|
BrowseRegions | 1 % | 260 | 0 | 3 ms | 21023 ms | 194 ms
|
BrowseCategoriesInRegion | 1 % | 256 | 0 | 3 ms | 3165 ms | 50 ms
|
SearchItemsInRegion | 5 % | 702 | 0 | 0 ms | 45009 ms | 108 ms
|
ViewItem | 13 % | 1839 | 0 | 3 ms | 45023 ms | 72 ms
|
ViewUserInfo | 3 % | 454 | 0 | 3 ms | 93003 ms | 342 ms
|
ViewBidHistory | 1 % | 240 | 0 | 3 ms | 773 ms | 56 ms
|
BuyNowAuth | 1 % | 195 | 0 | 2 ms | 3348 ms | 55 ms
|
BuyNow | 1 % | 185 | 18 | 5 ms | 3574 ms | 76 ms
|
StoreBuyBow | 1 % | 163 | 0 | 4 ms | 3385 ms | 43 ms
|
PutBidAuth | 4 % | 621 | 0 | 0 ms | 21043 ms | 59 ms
|
PutBid | 5 % | 763 | 87 | 4 ms | 21038 ms | 73 ms
|
StoreBid | 3 % | 496 | 1 | 5 ms | 3358 ms | 67 ms
|
PutCommentAuth | 0 % | 0 | 0 | 0 ms | 0 ms | 0 ms
|
PutComment | 0 % | 71 | 1 | 4 ms | 3200 ms | 77 ms
|
StoreComment | 0 % | 64 | 0 | 5 ms | 489 ms | 25 ms
|
Sell | 0 % | 75 | 0 | 0 ms | 37 ms | 2 ms
|
SelectCategoryToSellItem | 0 % | 82 | 0 | 3 ms | 21044 ms | 280 ms
|
SellItemForm | 0 % | 93 | 0 | 2 ms | 279 ms | 7 ms
|
RegisterItem | 0 % | 82 | 0 | 4 ms | 159 ms | 15 ms
|
AboutMe (auth form) | 1 % | 252 | 0 | 0 ms | 3425 ms | 30 ms
|
AboutMe | 2 % | 392 | 0 | 4 ms | 3690 ms | 65 ms
|
Back probability | 10 % | 1422 | 0 | 0 ms | 0 ms | 0 ms
|
End of Session | 1 % | 174 | 0 | 0 ms | 0 ms | 0 ms
|
Total | 100 % | 13398 | 111 | - | - | 93 ms
|
Average throughput | 450 req/s
| |||||
Completed sessions | 196
| |||||
Total time | 66324 seconds
| |||||
Average session time | 338 seconds
| |||||
| State name | % of total | Count | Errors | Minimum Time | Maximum Time | Average Time |
|---|---|---|---|---|---|---|
Home | 5 % | 25056 | 0 | 0 ms | 93433 ms | 2344 ms
|
Register | 1 % | 5315 | 0 | 0 ms | 93051 ms | 968 ms
|
RegisterUser | 1 % | 5199 | 164 | 5 ms | 93034 ms | 974 ms
|
Browse | 7 % | 36277 | 0 | 0 ms | 93625 ms | 1084 ms
|
BrowseCategories | 5 % | 25122 | 0 | 3 ms | 93736 ms | 952 ms
|
SearchItemsInCategory | 15 % | 74642 | 0 | 3 ms | 192071 ms | 821 ms
|
BrowseRegions | 2 % | 10290 | 0 | 3 ms | 93063 ms | 919 ms
|
BrowseCategoriesInRegion | 2 % | 9994 | 0 | 3 ms | 93719 ms | 982 ms
|
SearchItemsInRegion | 5 % | 24598 | 0 | 0 ms | 190018 ms | 777 ms
|
ViewItem | 13 % | 66489 | 0 | 3 ms | 93717 ms | 768 ms
|
ViewUserInfo | 3 % | 15205 | 0 | 3 ms | 93526 ms | 687 ms
|
ViewBidHistory | 1 % | 7916 | 0 | 3 ms | 93078 ms | 781 ms
|
BuyNowAuth | 1 % | 6250 | 0 | 2 ms | 93784 ms | 692 ms
|
BuyNow | 1 % | 6059 | 834 | 4 ms | 65097 ms | 697 ms
|
StoreBuyBow | 1 % | 5066 | 8 | 4 ms | 93035 ms | 660 ms
|
PutBidAuth | 4 % | 23250 | 0 | 0 ms | 190000 ms | 713 ms
|
PutBid | 5 % | 26316 | 2863 | 0 ms | 93593 ms | 694 ms
|
StoreBid | 3 % | 17087 | 24 | 4 ms | 93540 ms | 684 ms
|
PutCommentAuth | 0 % | 0 | 0 | 0 ms | 0 ms | 0 ms
|
PutComment | 0 % | 2235 | 164 | 3 ms | 45604 ms | 702 ms
|
StoreComment | 0 % | 2000 | 0 | 4 ms | 45584 ms | 628 ms
|
Sell | 0 % | 2922 | 0 | 0 ms | 93020 ms | 1055 ms
|
SelectCategoryToSellItem | 0 % | 2853 | 0 | 3 ms | 93020 ms | 973 ms
|
SellItemForm | 0 % | 2778 | 0 | 2 ms | 93001 ms | 870 ms
|
RegisterItem | 0 % | 2685 | 0 | 4 ms | 93044 ms | 999 ms
|
AboutMe (auth form) | 1 % | 8276 | 0 | 0 ms | 93568 ms | 1228 ms
|
AboutMe | 2 % | 13458 | 0 | 4 ms | 93480 ms | 901 ms
|
Back probability | 10 % | 48296 | 0 | 0 ms | 0 ms | 0 ms
|
End of Session | 1 % | 6821 | 0 | 0 ms | 0 ms | 0 ms
|
Total | 100 % | 482455 | 4057 | - | - | 810 ms
|
Average throughput | 810 req/s
| |||||
Completed sessions | 6821
| |||||
Total time | 1598606 seconds
| |||||
Average session time | 234 seconds
| |||||
An error occured while waiting for remote processes termination (Skipping waits)
Command is: /usr/bin/scp farm6.csail.mit.edu:/tmp/client1 /home/drkp/sandbox/txcache/src/RUBiS-1.4.3/bench/2009-3-20@4:21:17//client1.bin
Command is: /usr/bin/ssh -x localhost /bin/bash -c 'LANG=en_GB.UTF-8 /usr/bin/sar -n DEV -n SOCK -rubcw 1 605 -f /home/drkp/sandbox/txcache/src/RUBiS-1.4.3/bench/2009-3-20@4:21:17//client1.bin > /home/drkp/sandbox/txcache/src/RUBiS-1.4.3/bench/2009-3-20@4:21:17//client1'
Command is: /usr/bin/scp farm14:/tmp/db_server0 /home/drkp/sandbox/txcache/src/RUBiS-1.4.3/bench/2009-3-20@4:21:17//db_server0.bin
Command is: /usr/bin/ssh -x localhost /bin/bash -c 'LANG=en_GB.UTF-8 /usr/bin/sar -n DEV -n SOCK -rubcw 1 605 -f /home/drkp/sandbox/txcache/src/RUBiS-1.4.3/bench/2009-3-20@4:21:17//db_server0.bin > /home/drkp/sandbox/txcache/src/RUBiS-1.4.3/bench/2009-3-20@4:21:17//db_server0'
Command is: /usr/bin/scp farm12.csail.mit.edu:/tmp/web_server0 /home/drkp/sandbox/txcache/src/RUBiS-1.4.3/bench/2009-3-20@4:21:17//web_server0.bin
Command is: /usr/bin/ssh -x localhost /bin/bash -c 'LANG=en_GB.UTF-8 /usr/bin/sar -n DEV -n SOCK -rubcw 1 605 -f /home/drkp/sandbox/txcache/src/RUBiS-1.4.3/bench/2009-3-20@4:21:17//web_server0.bin > /home/drkp/sandbox/txcache/src/RUBiS-1.4.3/bench/2009-3-20@4:21:17//web_server0'
Command is: /usr/bin/scp farm13.csail.mit.edu:/tmp/web_server1 /home/drkp/sandbox/txcache/src/RUBiS-1.4.3/bench/2009-3-20@4:21:17//web_server1.bin
Command is: /usr/bin/ssh -x localhost /bin/bash -c 'LANG=en_GB.UTF-8 /usr/bin/sar -n DEV -n SOCK -rubcw 1 605 -f /home/drkp/sandbox/txcache/src/RUBiS-1.4.3/bench/2009-3-20@4:21:17//web_server1.bin > /home/drkp/sandbox/txcache/src/RUBiS-1.4.3/bench/2009-3-20@4:21:17//web_server1'
Command is: /usr/bin/scp localhost:/tmp/client0 /home/drkp/sandbox/txcache/src/RUBiS-1.4.3/bench/2009-3-20@4:21:17//client0.bin
Command is: /usr/bin/ssh -x localhost /bin/bash -c 'LANG=en_GB.UTF-8 /usr/bin/sar -n DEV -n SOCK -rubcw 1 605 -f /home/drkp/sandbox/txcache/src/RUBiS-1.4.3/bench/2009-3-20@4:21:17//client0.bin > /home/drkp/sandbox/txcache/src/RUBiS-1.4.3/bench/2009-3-20@4:21:17//client0'
Command is: /usr/bin/scp farm6.csail.mit.edu:/tmp/trace_client1.html /home/drkp/sandbox/txcache/src/RUBiS-1.4.3/bench/2009-3-20@4:21:17//
Command is: /usr/bin/scp farm6.csail.mit.edu:/tmp/stat_client1.html /home/drkp/sandbox/txcache/src/RUBiS-1.4.3/bench/2009-3-20@4:21:17//
|
|
|
|
|
|
 | 
|
 | 
|
 | 
|
 | 
|
 | 
|
 | 
|
 | 
|
 | 
|
 | 
|