Node information
Test timing information
Up ramp statistics
Runtime session statistics
Down ramp statistics
Overall statistics
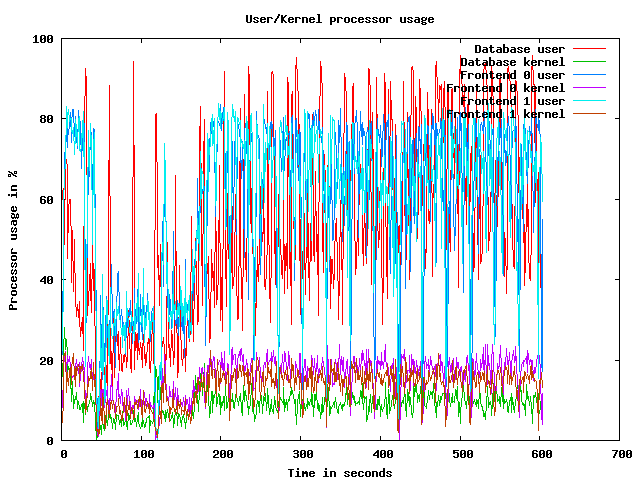
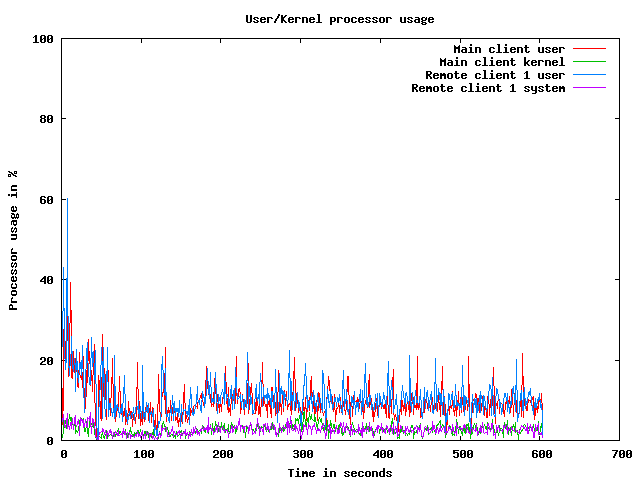
CPU usage graphs
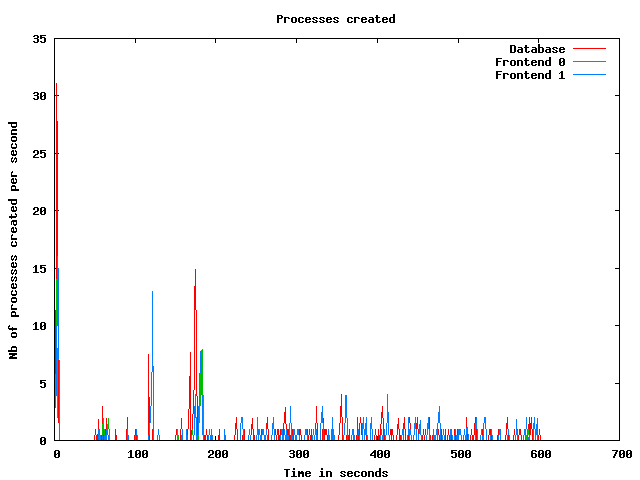
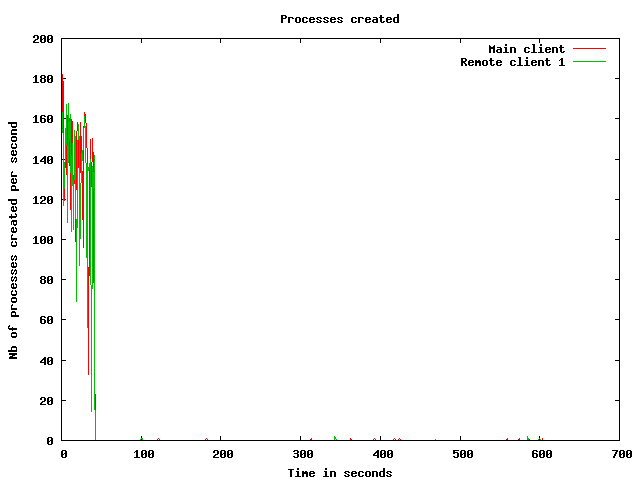
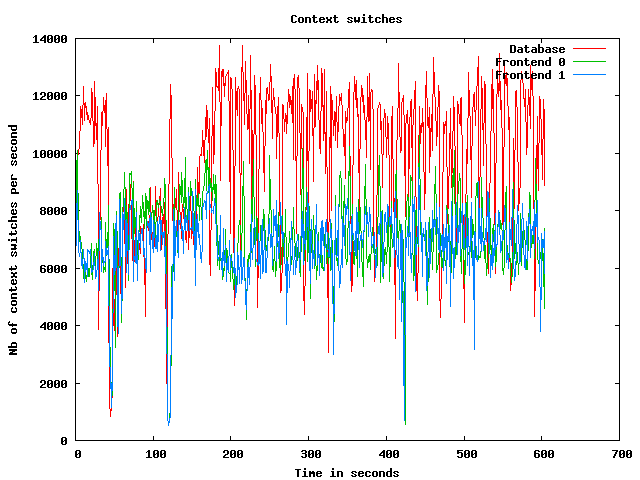
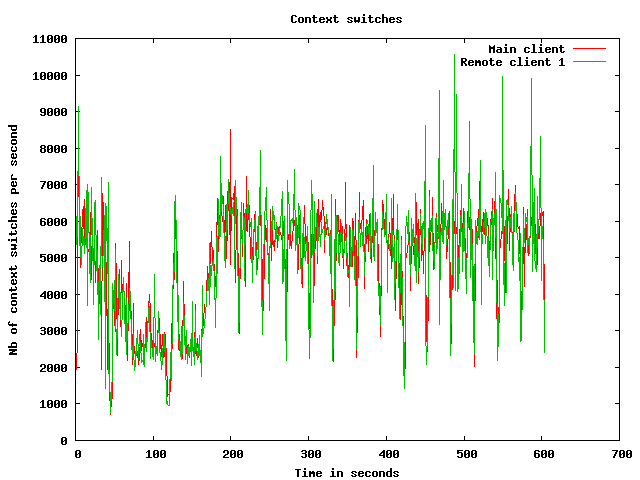
Processes usage graphs
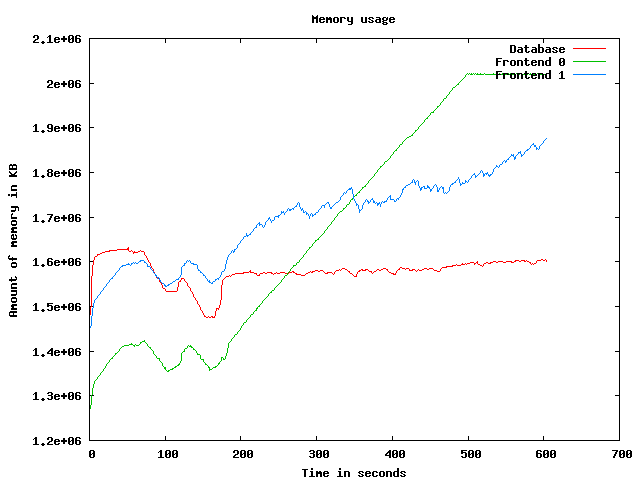
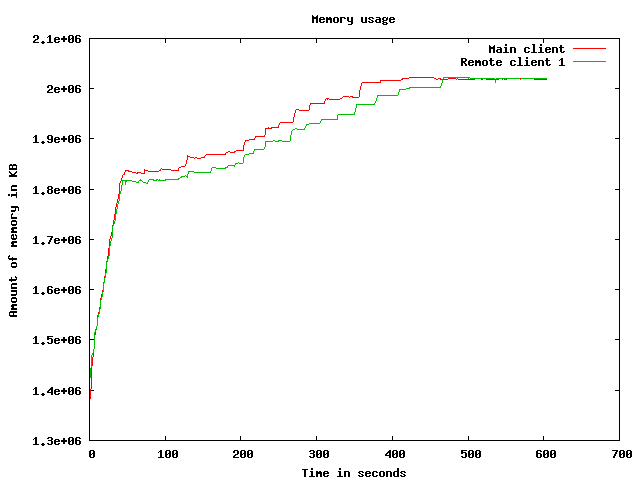
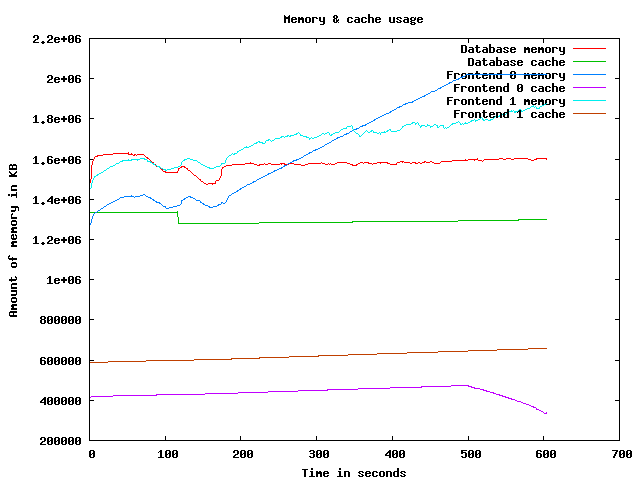
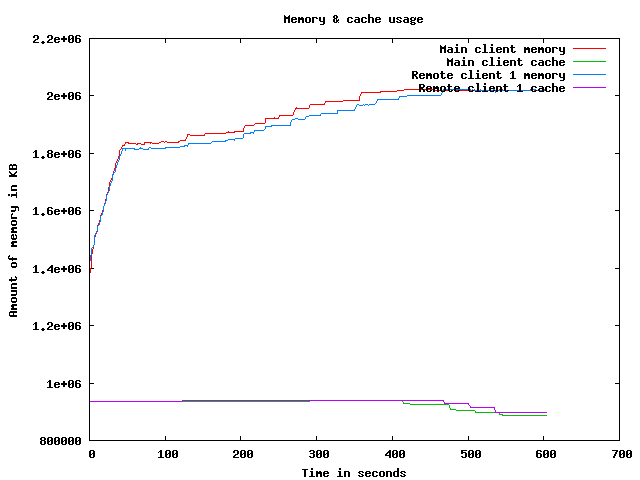
Memory usage graph
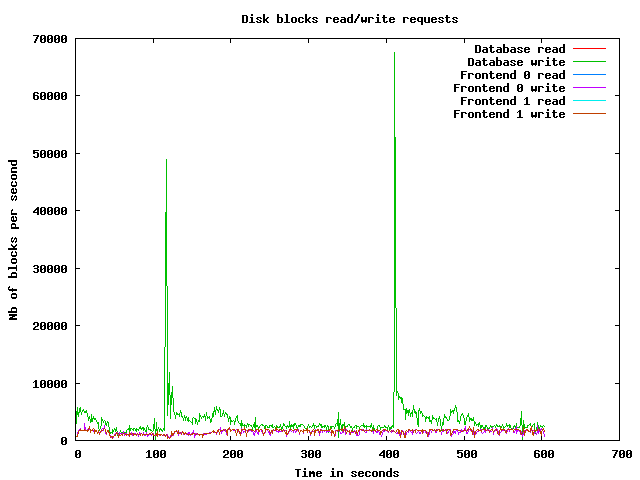
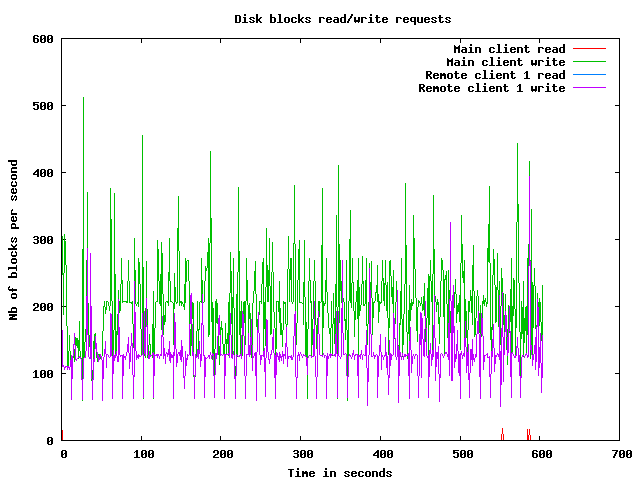
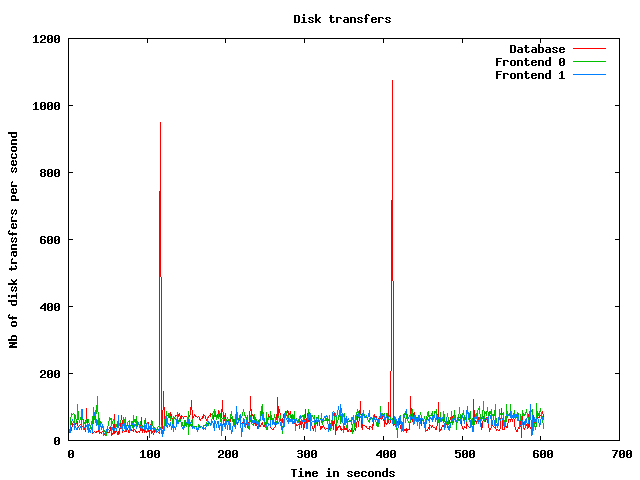
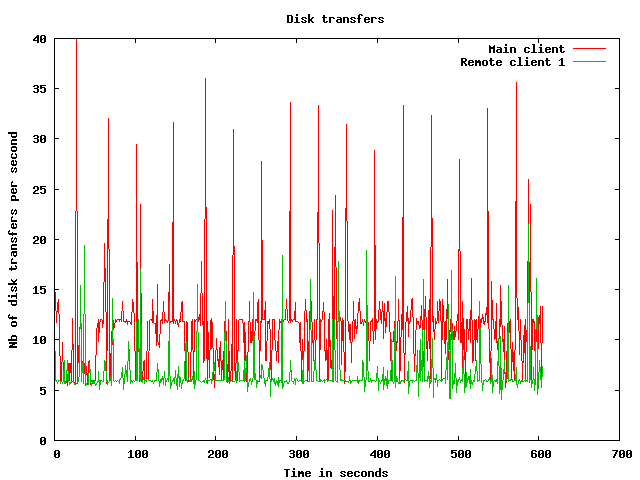
Disk usage graphs
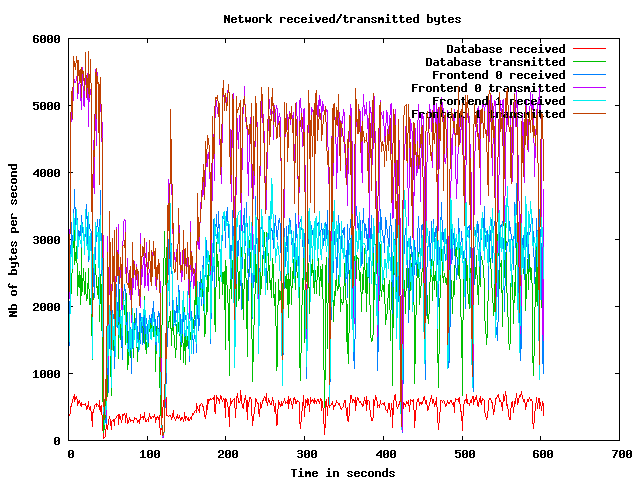
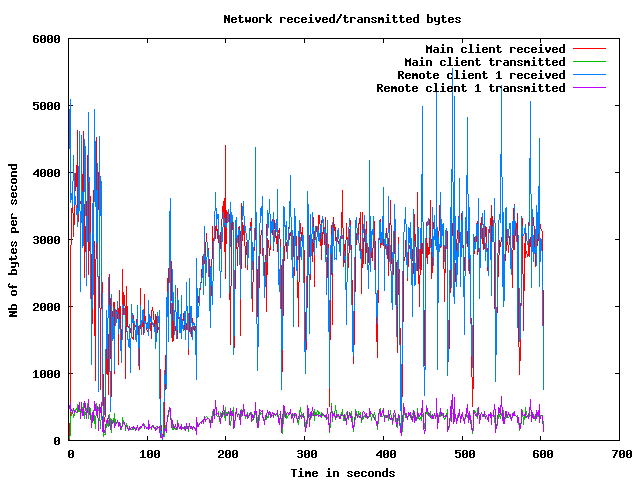
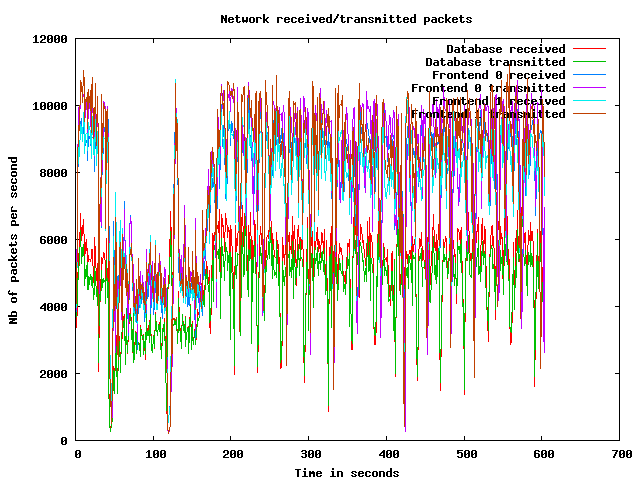
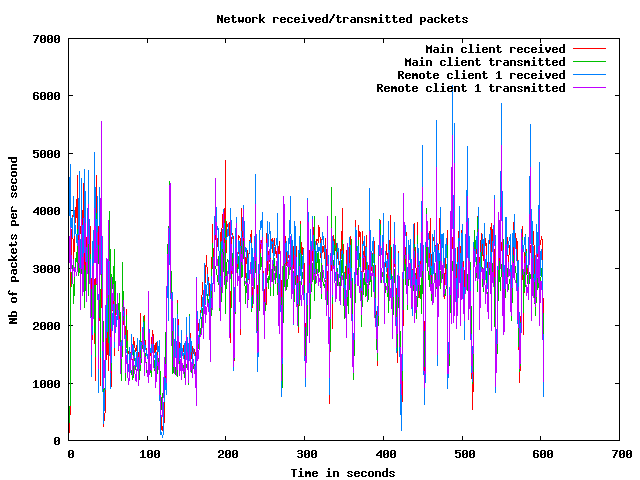
Network usage graphs
| Test start | 2009-3-20 4:35:3 |
| Up ramp start | 2009-3-20 4:35:47 |
| Runtime session start | 2009-3-20 4:37:47 |
| Down ramp start | 2009-3-20 4:45:17 |
| Test end | 2009-3-20 4:48:1 |
| Up ramp length | 2 minutes 0 millisecond (requested 120000 ms) |
| Runtime session length | 7 minutes 30 seconds 1 millisecond (requested 450000 ms) |
| Down ramp length | 30 seconds 0 millisecond (requested 30000 ms) |
| Total test length | 12 minutes 57 seconds 993 milliseconds |
| State name | % of total | Count | Errors | Minimum Time | Maximum Time | Average Time |
|---|---|---|---|---|---|---|
Home | 9 % | 9347 | 0 | 0 ms | 93774 ms | 7209 ms
|
Register | 1 % | 1309 | 0 | 0 ms | 93793 ms | 2787 ms
|
RegisterUser | 1 % | 1218 | 45 | 5 ms | 93100 ms | 2549 ms
|
Browse | 9 % | 9513 | 0 | 0 ms | 93704 ms | 3179 ms
|
BrowseCategories | 6 % | 6243 | 0 | 3 ms | 93791 ms | 2623 ms
|
SearchItemsInCategory | 14 % | 14364 | 0 | 3 ms | 93774 ms | 2174 ms
|
BrowseRegions | 2 % | 2666 | 0 | 3 ms | 93801 ms | 2091 ms
|
BrowseCategoriesInRegion | 2 % | 2479 | 0 | 3 ms | 93562 ms | 2173 ms
|
SearchItemsInRegion | 5 % | 5146 | 0 | 0 ms | 93193 ms | 1930 ms
|
ViewItem | 12 % | 12501 | 0 | 3 ms | 93801 ms | 2042 ms
|
ViewUserInfo | 2 % | 2259 | 0 | 3 ms | 93311 ms | 1977 ms
|
ViewBidHistory | 1 % | 1120 | 0 | 3 ms | 93298 ms | 2011 ms
|
BuyNowAuth | 1 % | 1107 | 0 | 2 ms | 93016 ms | 1887 ms
|
BuyNow | 0 % | 992 | 132 | 4 ms | 93013 ms | 1836 ms
|
StoreBuyBow | 0 % | 762 | 0 | 5 ms | 49020 ms | 1540 ms
|
PutBidAuth | 4 % | 4225 | 0 | 0 ms | 93041 ms | 1836 ms
|
PutBid | 4 % | 4129 | 509 | 4 ms | 93117 ms | 1928 ms
|
StoreBid | 2 % | 2489 | 0 | 4 ms | 93010 ms | 1861 ms
|
PutCommentAuth | 0 % | 0 | 0 | 0 ms | 0 ms | 0 ms
|
PutComment | 0 % | 373 | 28 | 4 ms | 45678 ms | 1516 ms
|
StoreComment | 0 % | 304 | 0 | 5 ms | 45311 ms | 1789 ms
|
Sell | 0 % | 763 | 0 | 0 ms | 93057 ms | 3332 ms
|
SelectCategoryToSellItem | 0 % | 714 | 0 | 3 ms | 45837 ms | 2439 ms
|
SellItemForm | 0 % | 669 | 0 | 2 ms | 93073 ms | 1965 ms
|
RegisterItem | 0 % | 628 | 0 | 4 ms | 93162 ms | 2526 ms
|
AboutMe (auth form) | 2 % | 2154 | 0 | 0 ms | 93533 ms | 3283 ms
|
AboutMe | 3 % | 3057 | 0 | 4 ms | 93737 ms | 2206 ms
|
Back probability | 7 % | 7767 | 0 | 0 ms | 0 ms | 0 ms
|
End of Session | 1 % | 1137 | 0 | 0 ms | 0 ms | 0 ms
|
Total | 100 % | 99435 | 714 | - | - | 2523 ms
|
Average throughput | 834 req/s
| |||||
Completed sessions | 1026
| |||||
Total time | 57386 seconds
| |||||
Average session time | 55 seconds
| |||||
| State name | % of total | Count | Errors | Minimum Time | Maximum Time | Average Time |
|---|---|---|---|---|---|---|
Home | 4 % | 14755 | 0 | 0 ms | 275454 ms | 595 ms
|
Register | 1 % | 3665 | 0 | 0 ms | 194485 ms | 1338 ms
|
RegisterUser | 1 % | 3616 | 135 | 5 ms | 194038 ms | 1280 ms
|
Browse | 7 % | 25172 | 0 | 0 ms | 235900 ms | 1490 ms
|
BrowseCategories | 4 % | 17795 | 0 | 3 ms | 237226 ms | 1558 ms
|
SearchItemsInCategory | 15 % | 55666 | 0 | 3 ms | 275095 ms | 1561 ms
|
BrowseRegions | 1 % | 7124 | 0 | 3 ms | 235921 ms | 1416 ms
|
BrowseCategoriesInRegion | 1 % | 7012 | 0 | 3 ms | 275089 ms | 1601 ms
|
SearchItemsInRegion | 5 % | 18341 | 0 | 0 ms | 213207 ms | 1566 ms
|
ViewItem | 14 % | 50270 | 0 | 3 ms | 321939 ms | 1511 ms
|
ViewUserInfo | 3 % | 11813 | 0 | 3 ms | 235528 ms | 1446 ms
|
ViewBidHistory | 1 % | 6198 | 0 | 3 ms | 193863 ms | 1438 ms
|
BuyNowAuth | 1 % | 4746 | 0 | 2 ms | 211971 ms | 1596 ms
|
BuyNow | 1 % | 4674 | 585 | 5 ms | 236135 ms | 1603 ms
|
StoreBuyBow | 1 % | 4031 | 5 | 5 ms | 220988 ms | 1378 ms
|
PutBidAuth | 5 % | 17950 | 0 | 0 ms | 235907 ms | 1452 ms
|
PutBid | 5 % | 20776 | 2166 | 4 ms | 235977 ms | 1594 ms
|
StoreBid | 3 % | 13727 | 15 | 4 ms | 235765 ms | 1540 ms
|
PutCommentAuth | 0 % | 0 | 0 | 0 ms | 0 ms | 0 ms
|
PutComment | 0 % | 1856 | 124 | 4 ms | 193764 ms | 1785 ms
|
StoreComment | 0 % | 1689 | 0 | 5 ms | 190681 ms | 1414 ms
|
Sell | 0 % | 1887 | 0 | 0 ms | 200199 ms | 1979 ms
|
SelectCategoryToSellItem | 0 % | 1858 | 0 | 3 ms | 201239 ms | 1525 ms
|
SellItemForm | 0 % | 1831 | 0 | 2 ms | 213020 ms | 1498 ms
|
RegisterItem | 0 % | 1805 | 0 | 5 ms | 192336 ms | 1227 ms
|
AboutMe (auth form) | 1 % | 5830 | 0 | 0 ms | 235697 ms | 1426 ms
|
AboutMe | 2 % | 9867 | 0 | 4 ms | 212117 ms | 1613 ms
|
Back probability | 10 % | 37598 | 0 | 0 ms | 0 ms | 0 ms
|
End of Session | 1 % | 5316 | 0 | 0 ms | 0 ms | 0 ms
|
Total | 100 % | 356868 | 3030 | - | - | 1291 ms
|
Average throughput | 799 req/s
| |||||
Completed sessions | 5347
| |||||
Total time | 1427313 seconds
| |||||
Average session time | 266 seconds
| |||||
| State name | % of total | Count | Errors | Minimum Time | Maximum Time | Average Time |
|---|---|---|---|---|---|---|
Home | 4 % | 568 | 0 | 0 ms | 190011 ms | 1122 ms
|
Register | 0 % | 137 | 0 | 0 ms | 189994 ms | 4529 ms
|
RegisterUser | 1 % | 149 | 7 | 5 ms | 93286 ms | 1605 ms
|
Browse | 7 % | 1006 | 0 | 0 ms | 190017 ms | 2237 ms
|
BrowseCategories | 4 % | 701 | 0 | 3 ms | 190080 ms | 3031 ms
|
SearchItemsInCategory | 15 % | 2154 | 0 | 3 ms | 283386 ms | 3293 ms
|
BrowseRegions | 1 % | 254 | 0 | 3 ms | 190083 ms | 4048 ms
|
BrowseCategoriesInRegion | 2 % | 285 | 0 | 3 ms | 190006 ms | 2604 ms
|
SearchItemsInRegion | 5 % | 705 | 0 | 0 ms | 191778 ms | 2630 ms
|
ViewItem | 14 % | 2022 | 0 | 3 ms | 190042 ms | 3009 ms
|
ViewUserInfo | 3 % | 441 | 0 | 3 ms | 193357 ms | 4729 ms
|
ViewBidHistory | 1 % | 260 | 0 | 4 ms | 190101 ms | 2332 ms
|
BuyNowAuth | 1 % | 186 | 0 | 2 ms | 93373 ms | 2366 ms
|
BuyNow | 1 % | 176 | 23 | 5 ms | 190114 ms | 3514 ms
|
StoreBuyBow | 1 % | 155 | 0 | 5 ms | 45338 ms | 2461 ms
|
PutBidAuth | 4 % | 684 | 0 | 0 ms | 190766 ms | 3158 ms
|
PutBid | 5 % | 816 | 94 | 4 ms | 283410 ms | 4151 ms
|
StoreBid | 3 % | 555 | 1 | 5 ms | 283369 ms | 3371 ms
|
PutCommentAuth | 0 % | 0 | 0 | 0 ms | 0 ms | 0 ms
|
PutComment | 0 % | 80 | 8 | 5 ms | 190067 ms | 5855 ms
|
StoreComment | 0 % | 85 | 0 | 5 ms | 10214 ms | 551 ms
|
Sell | 0 % | 76 | 0 | 0 ms | 45010 ms | 1037 ms
|
SelectCategoryToSellItem | 0 % | 74 | 0 | 4 ms | 93439 ms | 2989 ms
|
SellItemForm | 0 % | 75 | 0 | 2 ms | 190008 ms | 4407 ms
|
RegisterItem | 0 % | 73 | 0 | 4 ms | 93000 ms | 2819 ms
|
AboutMe (auth form) | 1 % | 246 | 0 | 0 ms | 45163 ms | 1864 ms
|
AboutMe | 2 % | 362 | 0 | 4 ms | 93065 ms | 2230 ms
|
Back probability | 10 % | 1523 | 0 | 0 ms | 0 ms | 0 ms
|
End of Session | 1 % | 214 | 0 | 0 ms | 0 ms | 0 ms
|
Total | 100 % | 14062 | 133 | - | - | 2595 ms
|
Average throughput | 473 req/s
| |||||
Completed sessions | 191
| |||||
Total time | 72446 seconds
| |||||
Average session time | 379 seconds
| |||||
| State name | % of total | Count | Errors | Minimum Time | Maximum Time | Average Time |
|---|---|---|---|---|---|---|
Home | 5 % | 24672 | 0 | 0 ms | 275454 ms | 3128 ms
|
Register | 1 % | 5111 | 0 | 0 ms | 194485 ms | 1832 ms
|
RegisterUser | 1 % | 4984 | 187 | 5 ms | 194038 ms | 1618 ms
|
Browse | 7 % | 35698 | 0 | 0 ms | 283014 ms | 2019 ms
|
BrowseCategories | 5 % | 24748 | 0 | 3 ms | 237226 ms | 1918 ms
|
SearchItemsInCategory | 15 % | 72515 | 0 | 3 ms | 380022 ms | 1796 ms
|
BrowseRegions | 2 % | 10047 | 0 | 3 ms | 235921 ms | 1737 ms
|
BrowseCategoriesInRegion | 2 % | 9780 | 0 | 3 ms | 275089 ms | 1862 ms
|
SearchItemsInRegion | 5 % | 24285 | 0 | 0 ms | 283146 ms | 1738 ms
|
ViewItem | 13 % | 64954 | 0 | 3 ms | 380006 ms | 1714 ms
|
ViewUserInfo | 3 % | 14550 | 0 | 3 ms | 283027 ms | 1676 ms
|
ViewBidHistory | 1 % | 7602 | 0 | 3 ms | 193863 ms | 1648 ms
|
BuyNowAuth | 1 % | 6040 | 0 | 2 ms | 283011 ms | 1814 ms
|
BuyNow | 1 % | 5846 | 740 | 4 ms | 236135 ms | 1797 ms
|
StoreBuyBow | 1 % | 4951 | 5 | 5 ms | 220988 ms | 1455 ms
|
PutBidAuth | 4 % | 22869 | 0 | 0 ms | 235907 ms | 1631 ms
|
PutBid | 5 % | 25798 | 2770 | 4 ms | 283410 ms | 1763 ms
|
StoreBid | 3 % | 16777 | 16 | 4 ms | 283369 ms | 1704 ms
|
PutCommentAuth | 0 % | 0 | 0 | 0 ms | 0 ms | 0 ms
|
PutComment | 0 % | 2310 | 161 | 4 ms | 283027 ms | 2169 ms
|
StoreComment | 0 % | 2080 | 0 | 5 ms | 283017 ms | 1660 ms
|
Sell | 0 % | 2726 | 0 | 0 ms | 200199 ms | 2401 ms
|
SelectCategoryToSellItem | 0 % | 2647 | 0 | 3 ms | 201239 ms | 1812 ms
|
SellItemForm | 0 % | 2575 | 0 | 2 ms | 213020 ms | 1852 ms
|
RegisterItem | 0 % | 2508 | 0 | 4 ms | 192336 ms | 1598 ms
|
AboutMe (auth form) | 1 % | 8235 | 0 | 0 ms | 283015 ms | 2016 ms
|
AboutMe | 2 % | 13360 | 0 | 4 ms | 283026 ms | 1855 ms
|
Back probability | 9 % | 46909 | 0 | 0 ms | 0 ms | 0 ms
|
End of Session | 1 % | 6668 | 0 | 0 ms | 0 ms | 0 ms
|
Total | 100 % | 471245 | 3879 | - | - | 1643 ms
|
Average throughput | 791 req/s
| |||||
Completed sessions | 6668
| |||||
Total time | 1597509 seconds
| |||||
Average session time | 239 seconds
| |||||
An error occured while waiting for remote processes termination (Skipping waits)
Command is: /usr/bin/scp farm6.csail.mit.edu:/tmp/client1 /home/drkp/sandbox/txcache/src/RUBiS-1.4.3/bench/2009-3-20@4:35:3//client1.bin
Command is: /usr/bin/ssh -x localhost /bin/bash -c 'LANG=en_GB.UTF-8 /usr/bin/sar -n DEV -n SOCK -rubcw 1 605 -f /home/drkp/sandbox/txcache/src/RUBiS-1.4.3/bench/2009-3-20@4:35:3//client1.bin > /home/drkp/sandbox/txcache/src/RUBiS-1.4.3/bench/2009-3-20@4:35:3//client1'
Command is: /usr/bin/scp farm14:/tmp/db_server0 /home/drkp/sandbox/txcache/src/RUBiS-1.4.3/bench/2009-3-20@4:35:3//db_server0.bin
Command is: /usr/bin/ssh -x localhost /bin/bash -c 'LANG=en_GB.UTF-8 /usr/bin/sar -n DEV -n SOCK -rubcw 1 605 -f /home/drkp/sandbox/txcache/src/RUBiS-1.4.3/bench/2009-3-20@4:35:3//db_server0.bin > /home/drkp/sandbox/txcache/src/RUBiS-1.4.3/bench/2009-3-20@4:35:3//db_server0'
Command is: /usr/bin/scp farm12.csail.mit.edu:/tmp/web_server0 /home/drkp/sandbox/txcache/src/RUBiS-1.4.3/bench/2009-3-20@4:35:3//web_server0.bin
Command is: /usr/bin/ssh -x localhost /bin/bash -c 'LANG=en_GB.UTF-8 /usr/bin/sar -n DEV -n SOCK -rubcw 1 605 -f /home/drkp/sandbox/txcache/src/RUBiS-1.4.3/bench/2009-3-20@4:35:3//web_server0.bin > /home/drkp/sandbox/txcache/src/RUBiS-1.4.3/bench/2009-3-20@4:35:3//web_server0'
Command is: /usr/bin/scp farm13.csail.mit.edu:/tmp/web_server1 /home/drkp/sandbox/txcache/src/RUBiS-1.4.3/bench/2009-3-20@4:35:3//web_server1.bin
Command is: /usr/bin/ssh -x localhost /bin/bash -c 'LANG=en_GB.UTF-8 /usr/bin/sar -n DEV -n SOCK -rubcw 1 605 -f /home/drkp/sandbox/txcache/src/RUBiS-1.4.3/bench/2009-3-20@4:35:3//web_server1.bin > /home/drkp/sandbox/txcache/src/RUBiS-1.4.3/bench/2009-3-20@4:35:3//web_server1'
Command is: /usr/bin/scp localhost:/tmp/client0 /home/drkp/sandbox/txcache/src/RUBiS-1.4.3/bench/2009-3-20@4:35:3//client0.bin
Command is: /usr/bin/ssh -x localhost /bin/bash -c 'LANG=en_GB.UTF-8 /usr/bin/sar -n DEV -n SOCK -rubcw 1 605 -f /home/drkp/sandbox/txcache/src/RUBiS-1.4.3/bench/2009-3-20@4:35:3//client0.bin > /home/drkp/sandbox/txcache/src/RUBiS-1.4.3/bench/2009-3-20@4:35:3//client0'
Command is: /usr/bin/scp farm6.csail.mit.edu:/tmp/trace_client1.html /home/drkp/sandbox/txcache/src/RUBiS-1.4.3/bench/2009-3-20@4:35:3//
Command is: /usr/bin/scp farm6.csail.mit.edu:/tmp/stat_client1.html /home/drkp/sandbox/txcache/src/RUBiS-1.4.3/bench/2009-3-20@4:35:3//
|
|
|
|
|
|
 | 
|
 | 
|
 | 
|
 | 
|
 | 
|
 | 
|
 | 
|
 | 
|
 | 
|