Node information
Test timing information
Up ramp statistics
Runtime session statistics
Down ramp statistics
Overall statistics
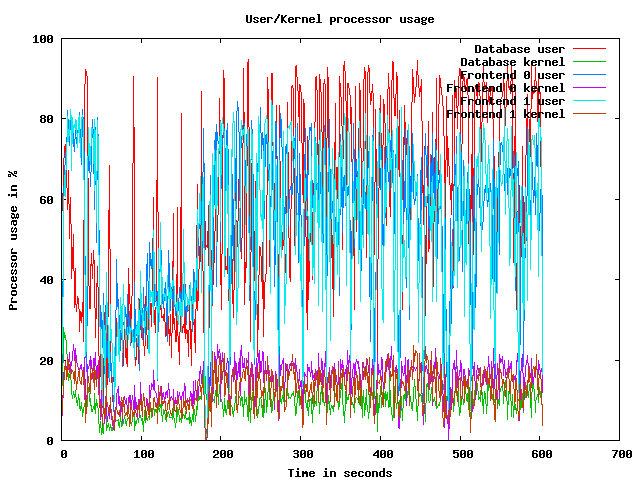
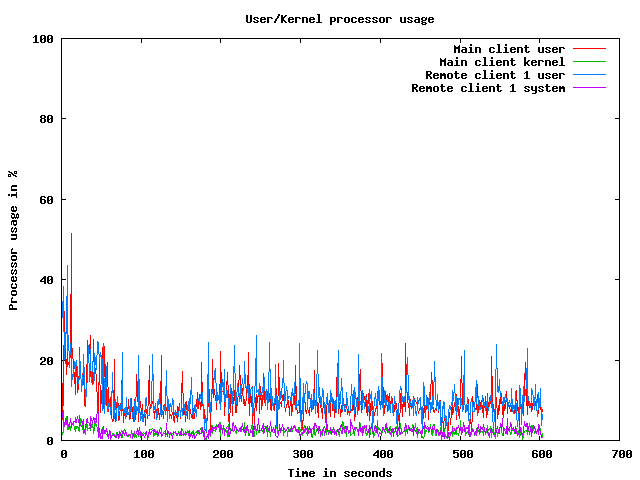
CPU usage graphs
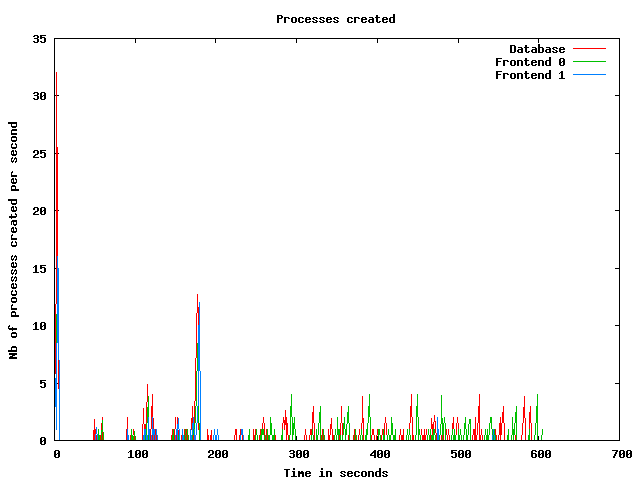
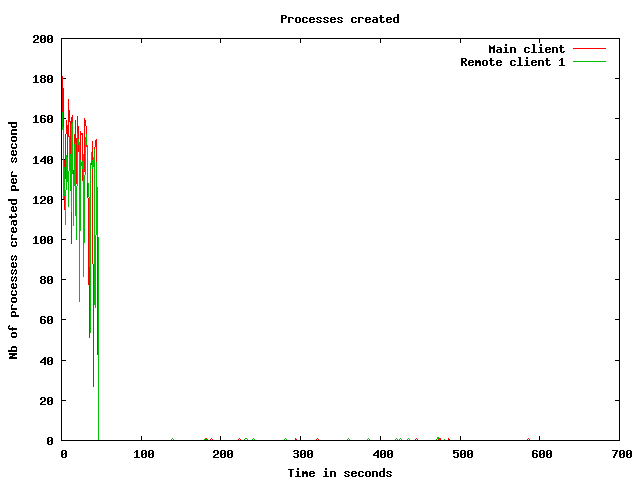
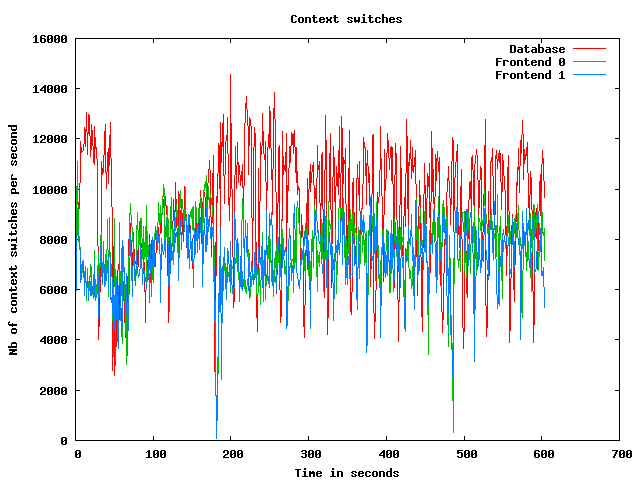
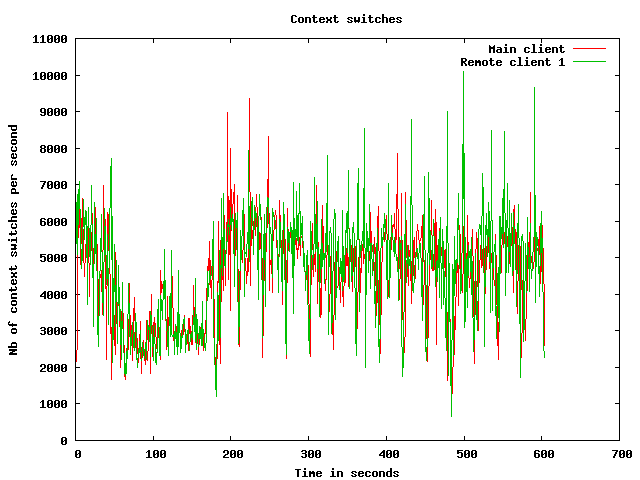
Processes usage graphs
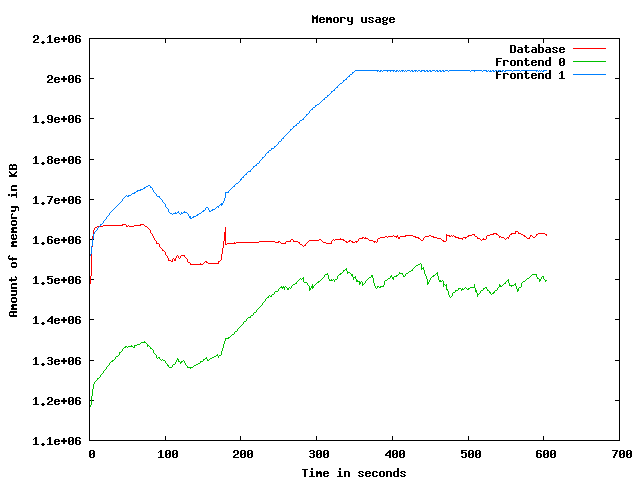
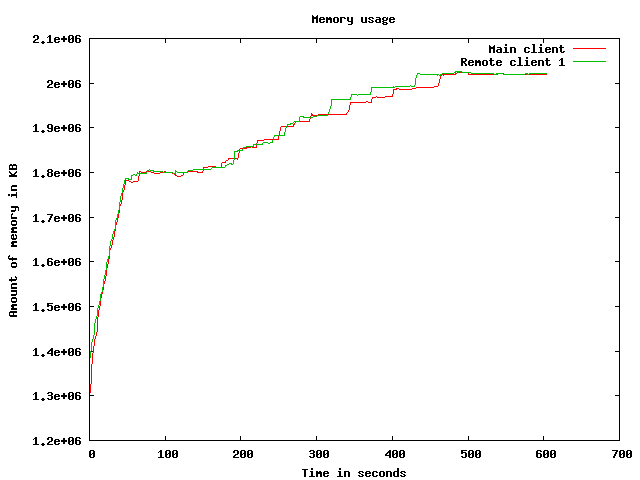
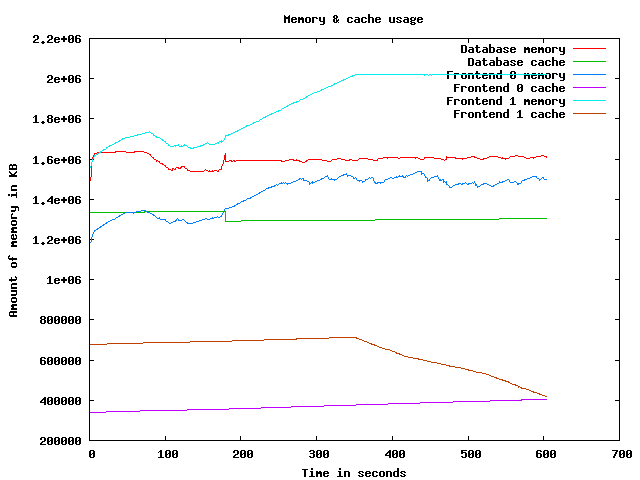
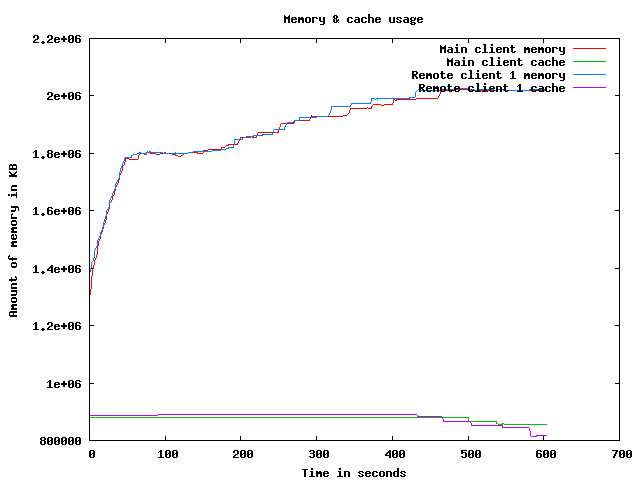
Memory usage graph
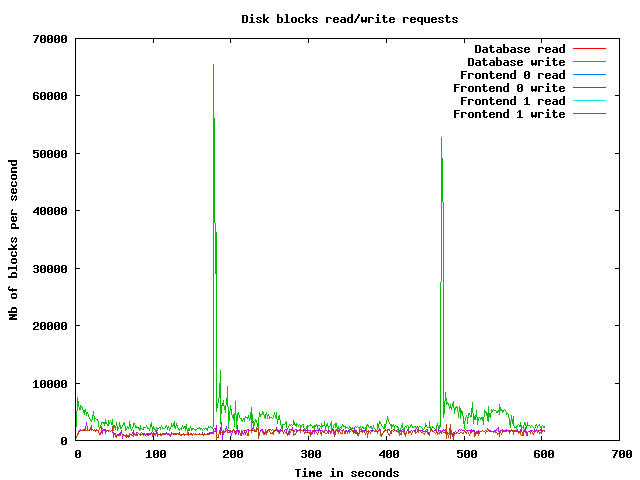
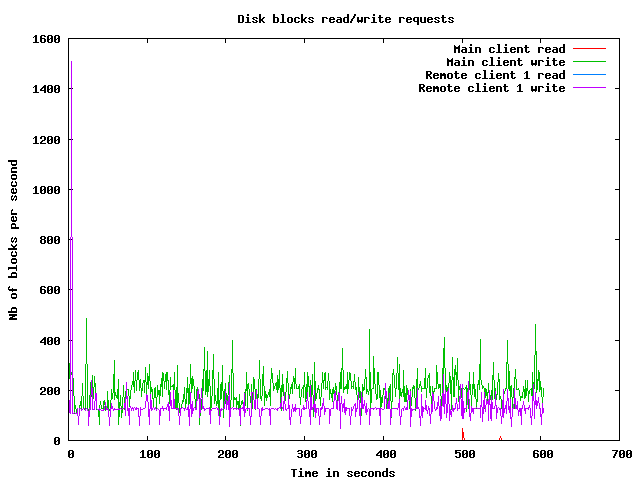
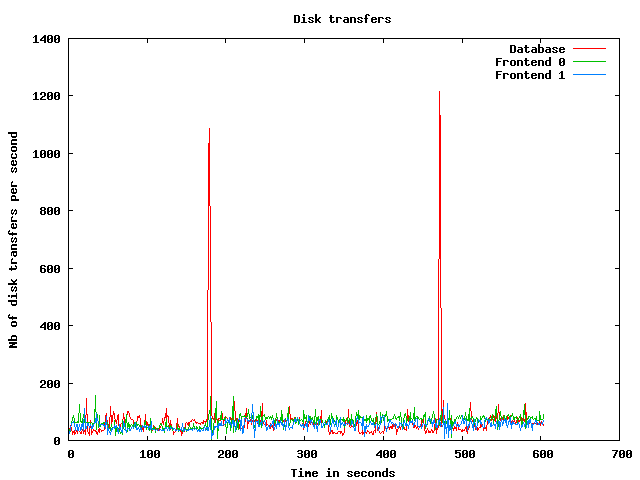
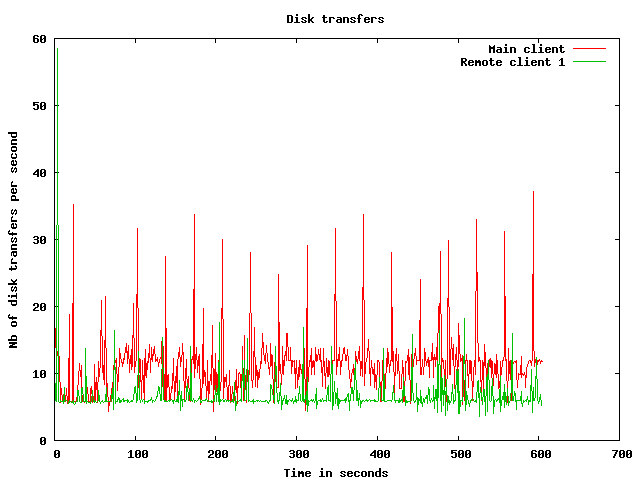
Disk usage graphs
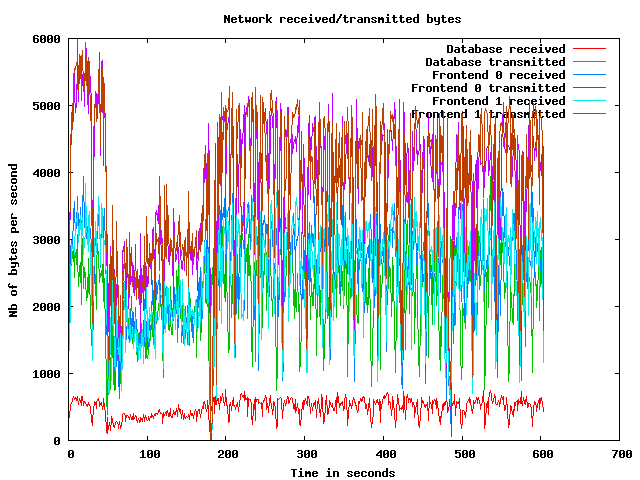
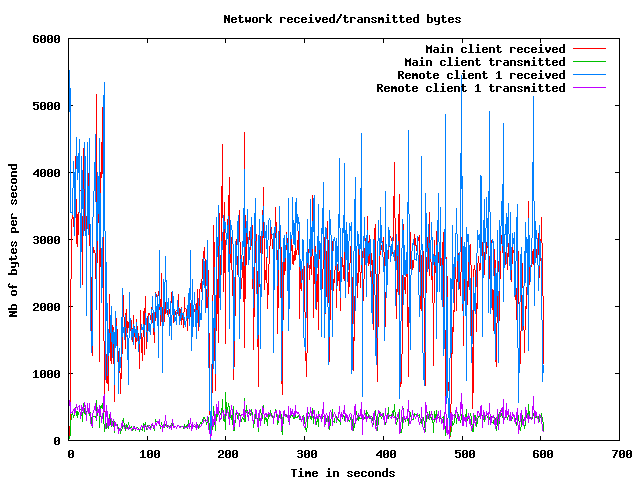
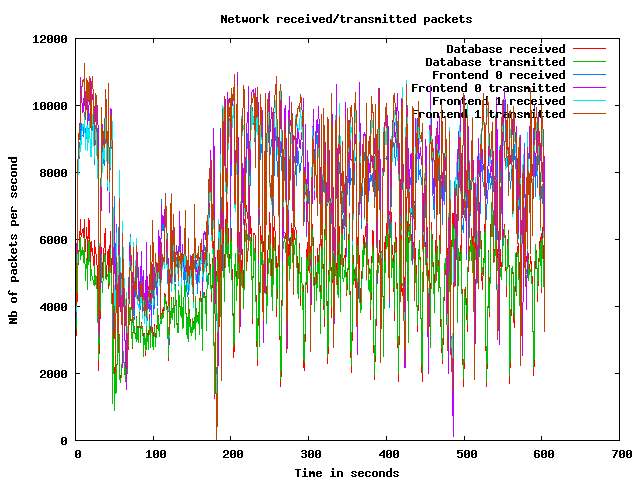
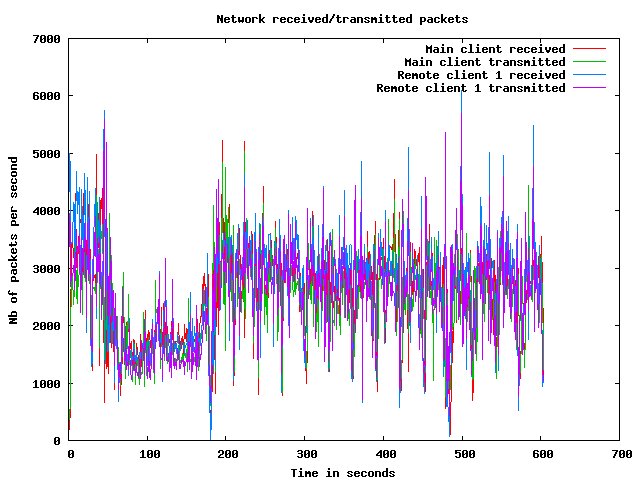
Network usage graphs
| Test start | 2009-3-20 4:49:2 |
| Up ramp start | 2009-3-20 4:49:49 |
| Runtime session start | 2009-3-20 4:51:49 |
| Down ramp start | 2009-3-20 4:59:19 |
| Test end | 2009-3-20 5:2:9 |
| Up ramp length | 2 minutes 1 millisecond (requested 120000 ms) |
| Runtime session length | 7 minutes 30 seconds 0 millisecond (requested 450000 ms) |
| Down ramp length | 30 seconds 0 millisecond (requested 30000 ms) |
| Total test length | 13 minutes 6 seconds 851 milliseconds |
| State name | % of total | Count | Errors | Minimum Time | Maximum Time | Average Time |
|---|---|---|---|---|---|---|
Home | 9 % | 9868 | 0 | 0 ms | 94456 ms | 8364 ms
|
Register | 1 % | 1364 | 0 | 0 ms | 93163 ms | 3167 ms
|
RegisterUser | 1 % | 1283 | 66 | 5 ms | 93081 ms | 2535 ms
|
Browse | 9 % | 10176 | 0 | 0 ms | 94561 ms | 3655 ms
|
BrowseCategories | 6 % | 6837 | 0 | 3 ms | 94636 ms | 2542 ms
|
SearchItemsInCategory | 14 % | 15557 | 0 | 3 ms | 94620 ms | 2409 ms
|
BrowseRegions | 2 % | 2713 | 0 | 3 ms | 93344 ms | 3201 ms
|
BrowseCategoriesInRegion | 2 % | 2527 | 0 | 3 ms | 94585 ms | 2716 ms
|
SearchItemsInRegion | 4 % | 5113 | 0 | 0 ms | 94532 ms | 2271 ms
|
ViewItem | 12 % | 13195 | 0 | 3 ms | 94597 ms | 2243 ms
|
ViewUserInfo | 2 % | 2477 | 0 | 3 ms | 93252 ms | 2126 ms
|
ViewBidHistory | 1 % | 1378 | 0 | 3 ms | 93429 ms | 1771 ms
|
BuyNowAuth | 1 % | 1120 | 0 | 2 ms | 93432 ms | 2372 ms
|
BuyNow | 0 % | 1007 | 118 | 5 ms | 93058 ms | 1915 ms
|
StoreBuyBow | 0 % | 790 | 0 | 5 ms | 93273 ms | 2058 ms
|
PutBidAuth | 4 % | 4586 | 0 | 0 ms | 94612 ms | 1871 ms
|
PutBid | 4 % | 4555 | 510 | 1 ms | 93438 ms | 2294 ms
|
StoreBid | 2 % | 2725 | 0 | 4 ms | 94632 ms | 2088 ms
|
PutCommentAuth | 0 % | 0 | 0 | 0 ms | 0 ms | 0 ms
|
PutComment | 0 % | 370 | 27 | 5 ms | 93450 ms | 1668 ms
|
StoreComment | 0 % | 300 | 0 | 5 ms | 93288 ms | 1711 ms
|
Sell | 0 % | 779 | 0 | 0 ms | 94543 ms | 3388 ms
|
SelectCategoryToSellItem | 0 % | 738 | 0 | 4 ms | 93290 ms | 2093 ms
|
SellItemForm | 0 % | 688 | 0 | 2 ms | 93202 ms | 2700 ms
|
RegisterItem | 0 % | 637 | 0 | 4 ms | 93094 ms | 3171 ms
|
AboutMe (auth form) | 2 % | 2229 | 0 | 0 ms | 94609 ms | 4213 ms
|
AboutMe | 2 % | 3122 | 0 | 4 ms | 94611 ms | 2615 ms
|
Back probability | 7 % | 8434 | 0 | 0 ms | 0 ms | 0 ms
|
End of Session | 1 % | 1131 | 0 | 0 ms | 0 ms | 0 ms
|
Total | 100 % | 105699 | 721 | - | - | 2859 ms
|
Average throughput | 886 req/s
| |||||
Completed sessions | 1026
| |||||
Total time | 61232 seconds
| |||||
Average session time | 59 seconds
| |||||
| State name | % of total | Count | Errors | Minimum Time | Maximum Time | Average Time |
|---|---|---|---|---|---|---|
Home | 4 % | 12992 | 0 | 0 ms | 321896 ms | 1300 ms
|
Register | 1 % | 3299 | 0 | 0 ms | 214315 ms | 3092 ms
|
RegisterUser | 1 % | 3225 | 186 | 4 ms | 321976 ms | 3391 ms
|
Browse | 6 % | 22046 | 0 | 0 ms | 321875 ms | 2899 ms
|
BrowseCategories | 4 % | 15403 | 0 | 3 ms | 426236 ms | 3003 ms
|
SearchItemsInCategory | 15 % | 48255 | 0 | 3 ms | 426434 ms | 3011 ms
|
BrowseRegions | 2 % | 6382 | 0 | 3 ms | 380051 ms | 3058 ms
|
BrowseCategoriesInRegion | 1 % | 6256 | 0 | 3 ms | 384021 ms | 3166 ms
|
SearchItemsInRegion | 5 % | 16616 | 0 | 0 ms | 344294 ms | 2886 ms
|
ViewItem | 14 % | 44789 | 0 | 3 ms | 426447 ms | 2777 ms
|
ViewUserInfo | 3 % | 10803 | 0 | 3 ms | 267876 ms | 3007 ms
|
ViewBidHistory | 1 % | 5502 | 0 | 3 ms | 283676 ms | 3163 ms
|
BuyNowAuth | 1 % | 4179 | 0 | 2 ms | 267793 ms | 3299 ms
|
BuyNow | 1 % | 4111 | 515 | 5 ms | 380037 ms | 2944 ms
|
StoreBuyBow | 1 % | 3524 | 3 | 4 ms | 226986 ms | 3279 ms
|
PutBidAuth | 4 % | 15798 | 0 | 0 ms | 380010 ms | 2876 ms
|
PutBid | 5 % | 18287 | 1942 | 4 ms | 426378 ms | 2914 ms
|
StoreBid | 3 % | 12058 | 15 | 5 ms | 382304 ms | 2902 ms
|
PutCommentAuth | 0 % | 0 | 0 | 0 ms | 0 ms | 0 ms
|
PutComment | 0 % | 1613 | 93 | 4 ms | 283763 ms | 3349 ms
|
StoreComment | 0 % | 1496 | 0 | 5 ms | 328738 ms | 3456 ms
|
Sell | 0 % | 1710 | 0 | 0 ms | 237815 ms | 3091 ms
|
SelectCategoryToSellItem | 0 % | 1683 | 0 | 4 ms | 213423 ms | 2936 ms
|
SellItemForm | 0 % | 1663 | 0 | 2 ms | 283838 ms | 3420 ms
|
RegisterItem | 0 % | 1638 | 0 | 5 ms | 239534 ms | 3635 ms
|
AboutMe (auth form) | 1 % | 5315 | 0 | 0 ms | 321913 ms | 2984 ms
|
AboutMe | 2 % | 9162 | 0 | 4 ms | 329079 ms | 3337 ms
|
Back probability | 10 % | 33607 | 0 | 0 ms | 0 ms | 0 ms
|
End of Session | 1 % | 4584 | 0 | 0 ms | 0 ms | 0 ms
|
Total | 100 % | 315996 | 2754 | - | - | 2526 ms
|
Average throughput | 708 req/s
| |||||
Completed sessions | 4615
| |||||
Total time | 1297570 seconds
| |||||
Average session time | 281 seconds
| |||||
| State name | % of total | Count | Errors | Minimum Time | Maximum Time | Average Time |
|---|---|---|---|---|---|---|
Home | 3 % | 499 | 0 | 0 ms | 211075 ms | 4188 ms
|
Register | 1 % | 144 | 0 | 0 ms | 190001 ms | 4479 ms
|
RegisterUser | 0 % | 130 | 5 | 5 ms | 190015 ms | 7137 ms
|
Browse | 7 % | 953 | 0 | 0 ms | 432652 ms | 8375 ms
|
BrowseCategories | 4 % | 640 | 0 | 3 ms | 383015 ms | 6721 ms
|
SearchItemsInCategory | 15 % | 2004 | 0 | 3 ms | 283004 ms | 7122 ms
|
BrowseRegions | 2 % | 289 | 0 | 3 ms | 383008 ms | 7427 ms
|
BrowseCategoriesInRegion | 2 % | 287 | 0 | 3 ms | 305423 ms | 7281 ms
|
SearchItemsInRegion | 5 % | 670 | 0 | 0 ms | 203983 ms | 8617 ms
|
ViewItem | 13 % | 1854 | 0 | 3 ms | 380001 ms | 6946 ms
|
ViewUserInfo | 3 % | 490 | 0 | 3 ms | 212854 ms | 6104 ms
|
ViewBidHistory | 1 % | 240 | 0 | 3 ms | 190017 ms | 5506 ms
|
BuyNowAuth | 1 % | 170 | 0 | 2 ms | 120459 ms | 3278 ms
|
BuyNow | 1 % | 159 | 23 | 4 ms | 193085 ms | 4923 ms
|
StoreBuyBow | 1 % | 135 | 0 | 4 ms | 244993 ms | 13207 ms
|
PutBidAuth | 5 % | 672 | 0 | 0 ms | 310826 ms | 9733 ms
|
PutBid | 5 % | 786 | 73 | 4 ms | 244989 ms | 6005 ms
|
StoreBid | 3 % | 513 | 0 | 5 ms | 235209 ms | 7750 ms
|
PutCommentAuth | 0 % | 0 | 0 | 0 ms | 0 ms | 0 ms
|
PutComment | 0 % | 74 | 4 | 4 ms | 190034 ms | 12147 ms
|
StoreComment | 0 % | 63 | 0 | 5 ms | 193002 ms | 8925 ms
|
Sell | 0 % | 65 | 0 | 0 ms | 190030 ms | 6364 ms
|
SelectCategoryToSellItem | 0 % | 59 | 0 | 4 ms | 190011 ms | 4780 ms
|
SellItemForm | 0 % | 70 | 0 | 2 ms | 190003 ms | 12459 ms
|
RegisterItem | 0 % | 81 | 0 | 5 ms | 379999 ms | 12870 ms
|
AboutMe (auth form) | 1 % | 210 | 0 | 0 ms | 203856 ms | 11520 ms
|
AboutMe | 2 % | 350 | 0 | 4 ms | 211109 ms | 3271 ms
|
Back probability | 10 % | 1445 | 0 | 0 ms | 0 ms | 0 ms
|
End of Session | 1 % | 197 | 0 | 0 ms | 0 ms | 0 ms
|
Total | 100 % | 13249 | 105 | - | - | 6246 ms
|
Average throughput | 445 req/s
| |||||
Completed sessions | 174
| |||||
Total time | 71805 seconds
| |||||
Average session time | 412 seconds
| |||||
| State name | % of total | Count | Errors | Minimum Time | Maximum Time | Average Time |
|---|---|---|---|---|---|---|
Home | 5 % | 23367 | 0 | 0 ms | 380037 ms | 4502 ms
|
Register | 1 % | 4817 | 0 | 0 ms | 380003 ms | 3423 ms
|
RegisterUser | 1 % | 4646 | 257 | 4 ms | 380010 ms | 3579 ms
|
Browse | 7 % | 33253 | 0 | 0 ms | 472998 ms | 3718 ms
|
BrowseCategories | 5 % | 22934 | 0 | 3 ms | 426236 ms | 3426 ms
|
SearchItemsInCategory | 15 % | 66259 | 0 | 3 ms | 426434 ms | 3449 ms
|
BrowseRegions | 2 % | 9407 | 0 | 3 ms | 472996 ms | 3779 ms
|
BrowseCategoriesInRegion | 2 % | 9097 | 0 | 3 ms | 384021 ms | 3611 ms
|
SearchItemsInRegion | 5 % | 22539 | 0 | 0 ms | 380009 ms | 3290 ms
|
ViewItem | 13 % | 60128 | 0 | 3 ms | 426447 ms | 3131 ms
|
ViewUserInfo | 3 % | 13832 | 0 | 3 ms | 380051 ms | 3362 ms
|
ViewBidHistory | 1 % | 7157 | 0 | 3 ms | 380170 ms | 3361 ms
|
BuyNowAuth | 1 % | 5482 | 0 | 2 ms | 267793 ms | 3515 ms
|
BuyNow | 1 % | 5292 | 656 | 4 ms | 380042 ms | 3309 ms
|
StoreBuyBow | 1 % | 4464 | 3 | 4 ms | 380042 ms | 4019 ms
|
PutBidAuth | 4 % | 21107 | 0 | 0 ms | 472999 ms | 3279 ms
|
PutBid | 5 % | 23743 | 2530 | 1 ms | 426378 ms | 3230 ms
|
StoreBid | 3 % | 15332 | 15 | 4 ms | 382304 ms | 3360 ms
|
PutCommentAuth | 0 % | 0 | 0 | 0 ms | 0 ms | 0 ms
|
PutComment | 0 % | 2065 | 124 | 4 ms | 380056 ms | 3740 ms
|
StoreComment | 0 % | 1863 | 0 | 5 ms | 328738 ms | 3761 ms
|
Sell | 0 % | 2561 | 0 | 0 ms | 237815 ms | 3404 ms
|
SelectCategoryToSellItem | 0 % | 2482 | 0 | 4 ms | 213423 ms | 2993 ms
|
SellItemForm | 0 % | 2426 | 0 | 2 ms | 283838 ms | 3917 ms
|
RegisterItem | 0 % | 2363 | 0 | 4 ms | 380019 ms | 4637 ms
|
AboutMe (auth form) | 1 % | 7773 | 0 | 0 ms | 321913 ms | 3980 ms
|
AboutMe | 2 % | 12743 | 0 | 4 ms | 380281 ms | 3673 ms
|
Back probability | 9 % | 43582 | 0 | 0 ms | 0 ms | 0 ms
|
End of Session | 1 % | 5927 | 0 | 0 ms | 0 ms | 0 ms
|
Total | 100 % | 436641 | 3585 | - | - | 3070 ms
|
Average throughput | 733 req/s
| |||||
Completed sessions | 5927
| |||||
Total time | 1481750 seconds
| |||||
Average session time | 250 seconds
| |||||
An error occured while waiting for remote processes termination (Skipping waits)
Command is: /usr/bin/scp farm6.csail.mit.edu:/tmp/client1 /home/drkp/sandbox/txcache/src/RUBiS-1.4.3/bench/2009-3-20@4:49:2//client1.bin
Command is: /usr/bin/ssh -x localhost /bin/bash -c 'LANG=en_GB.UTF-8 /usr/bin/sar -n DEV -n SOCK -rubcw 1 605 -f /home/drkp/sandbox/txcache/src/RUBiS-1.4.3/bench/2009-3-20@4:49:2//client1.bin > /home/drkp/sandbox/txcache/src/RUBiS-1.4.3/bench/2009-3-20@4:49:2//client1'
Command is: /usr/bin/scp farm14:/tmp/db_server0 /home/drkp/sandbox/txcache/src/RUBiS-1.4.3/bench/2009-3-20@4:49:2//db_server0.bin
Command is: /usr/bin/ssh -x localhost /bin/bash -c 'LANG=en_GB.UTF-8 /usr/bin/sar -n DEV -n SOCK -rubcw 1 605 -f /home/drkp/sandbox/txcache/src/RUBiS-1.4.3/bench/2009-3-20@4:49:2//db_server0.bin > /home/drkp/sandbox/txcache/src/RUBiS-1.4.3/bench/2009-3-20@4:49:2//db_server0'
Command is: /usr/bin/scp farm12.csail.mit.edu:/tmp/web_server0 /home/drkp/sandbox/txcache/src/RUBiS-1.4.3/bench/2009-3-20@4:49:2//web_server0.bin
Command is: /usr/bin/ssh -x localhost /bin/bash -c 'LANG=en_GB.UTF-8 /usr/bin/sar -n DEV -n SOCK -rubcw 1 605 -f /home/drkp/sandbox/txcache/src/RUBiS-1.4.3/bench/2009-3-20@4:49:2//web_server0.bin > /home/drkp/sandbox/txcache/src/RUBiS-1.4.3/bench/2009-3-20@4:49:2//web_server0'
Command is: /usr/bin/scp farm13.csail.mit.edu:/tmp/web_server1 /home/drkp/sandbox/txcache/src/RUBiS-1.4.3/bench/2009-3-20@4:49:2//web_server1.bin
Command is: /usr/bin/ssh -x localhost /bin/bash -c 'LANG=en_GB.UTF-8 /usr/bin/sar -n DEV -n SOCK -rubcw 1 605 -f /home/drkp/sandbox/txcache/src/RUBiS-1.4.3/bench/2009-3-20@4:49:2//web_server1.bin > /home/drkp/sandbox/txcache/src/RUBiS-1.4.3/bench/2009-3-20@4:49:2//web_server1'
Command is: /usr/bin/scp localhost:/tmp/client0 /home/drkp/sandbox/txcache/src/RUBiS-1.4.3/bench/2009-3-20@4:49:2//client0.bin
Command is: /usr/bin/ssh -x localhost /bin/bash -c 'LANG=en_GB.UTF-8 /usr/bin/sar -n DEV -n SOCK -rubcw 1 605 -f /home/drkp/sandbox/txcache/src/RUBiS-1.4.3/bench/2009-3-20@4:49:2//client0.bin > /home/drkp/sandbox/txcache/src/RUBiS-1.4.3/bench/2009-3-20@4:49:2//client0'
Command is: /usr/bin/scp farm6.csail.mit.edu:/tmp/trace_client1.html /home/drkp/sandbox/txcache/src/RUBiS-1.4.3/bench/2009-3-20@4:49:2//
Command is: /usr/bin/scp farm6.csail.mit.edu:/tmp/stat_client1.html /home/drkp/sandbox/txcache/src/RUBiS-1.4.3/bench/2009-3-20@4:49:2//
|
|
|
|
|
|
 | 
|
 | 
|
 | 
|
 | 
|
 | 
|
 | 
|
 | 
|
 | 
|
 | 
|