
Node information
Test timing information
Up ramp statistics
Runtime session statistics
Down ramp statistics
Overall statistics
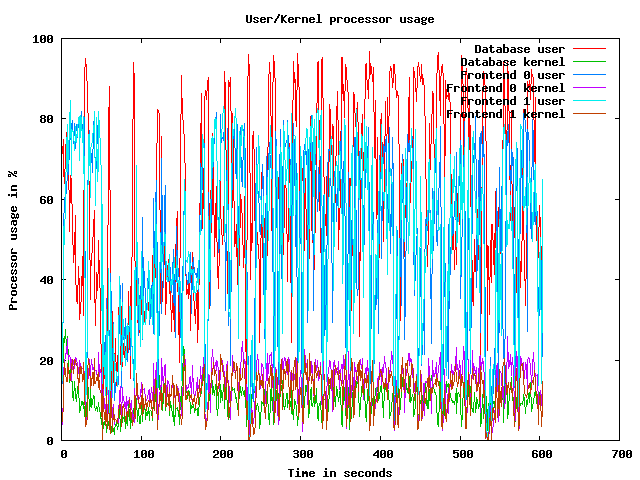
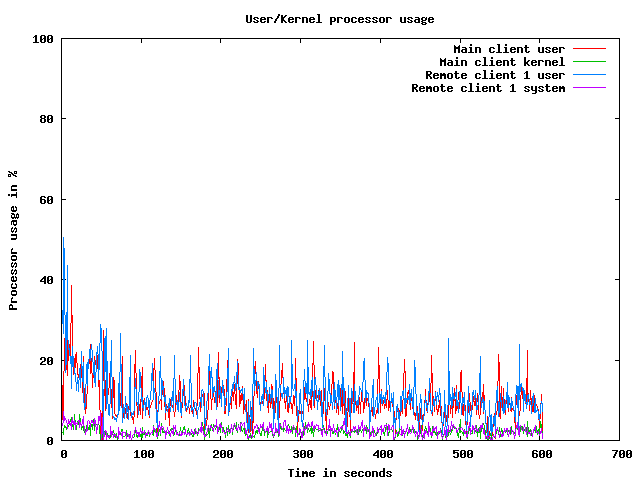
CPU usage graphs
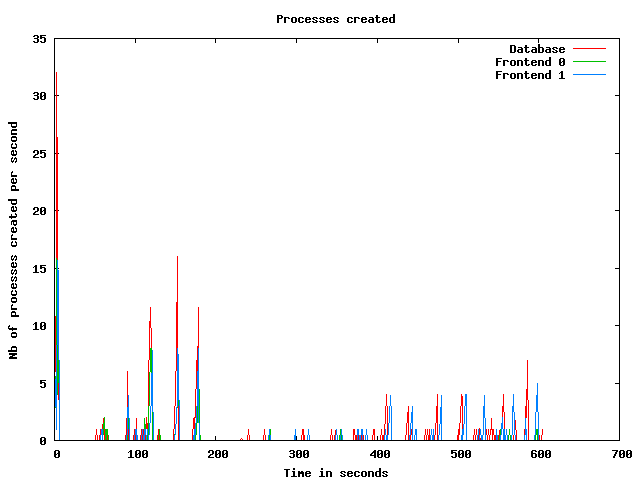
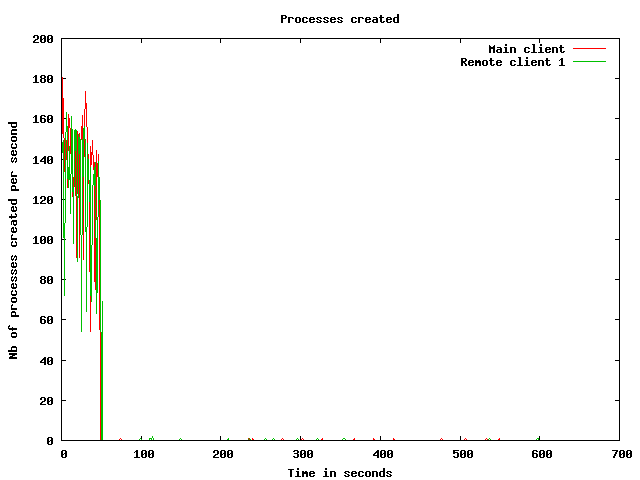
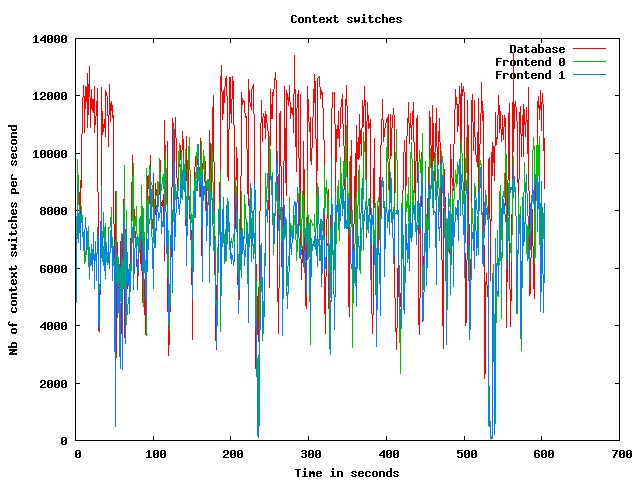
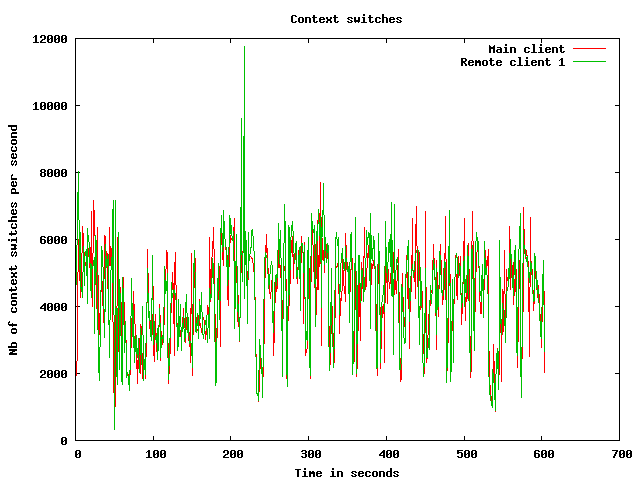
Processes usage graphs
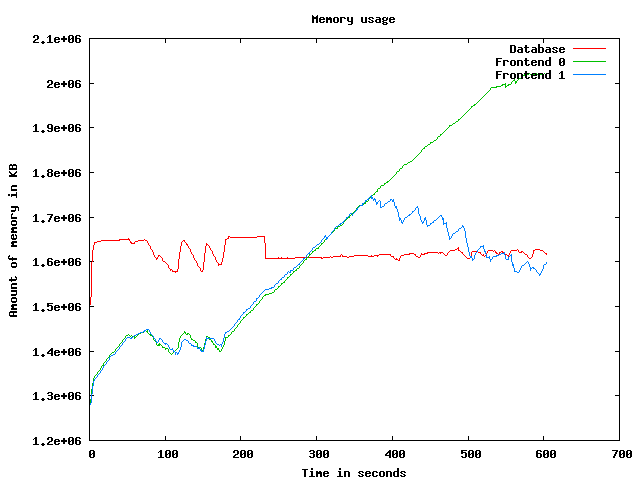
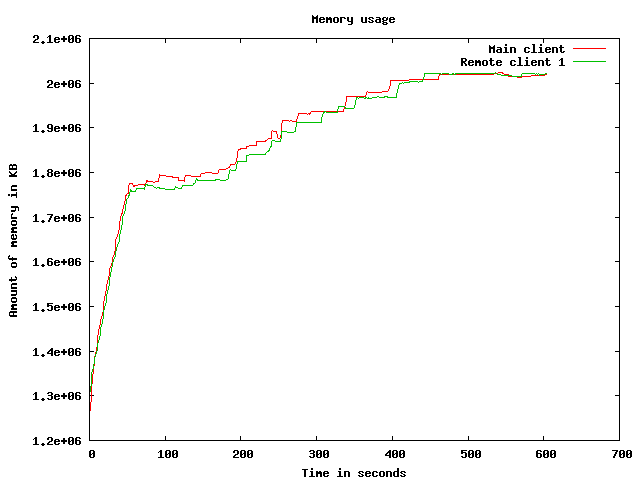
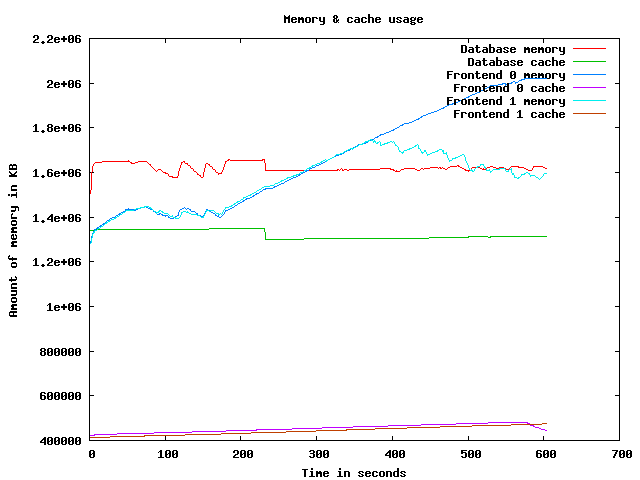
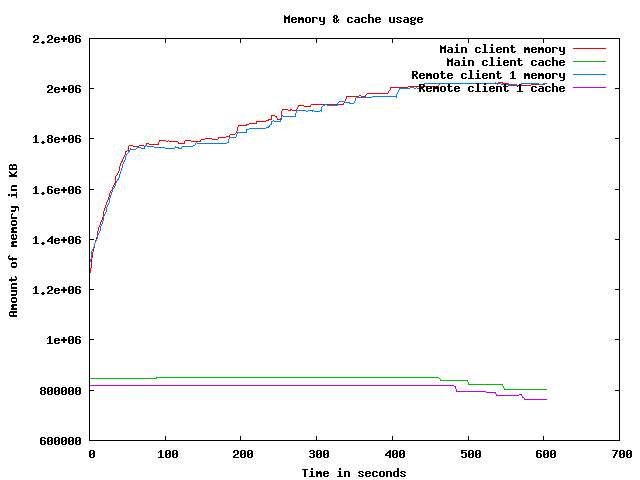
Memory usage graph
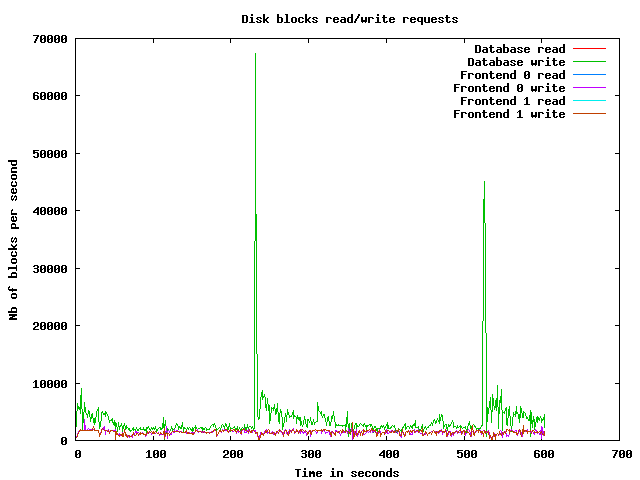
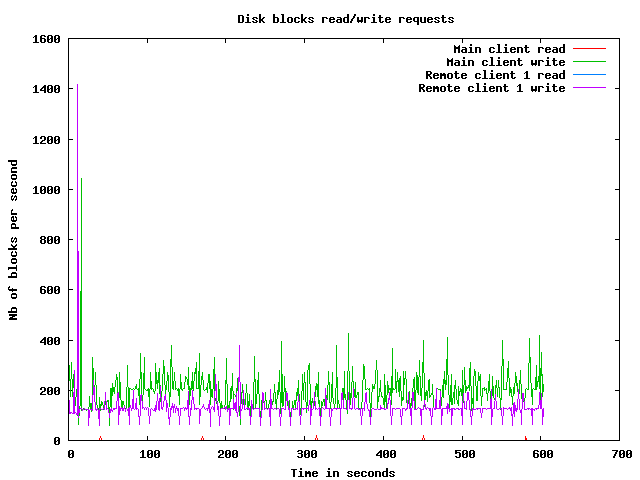
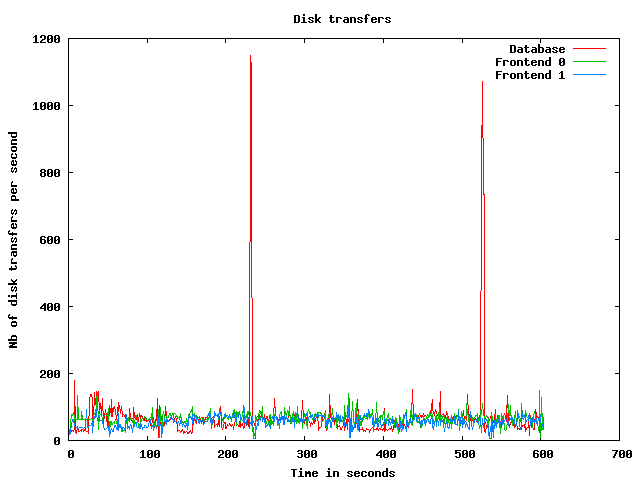
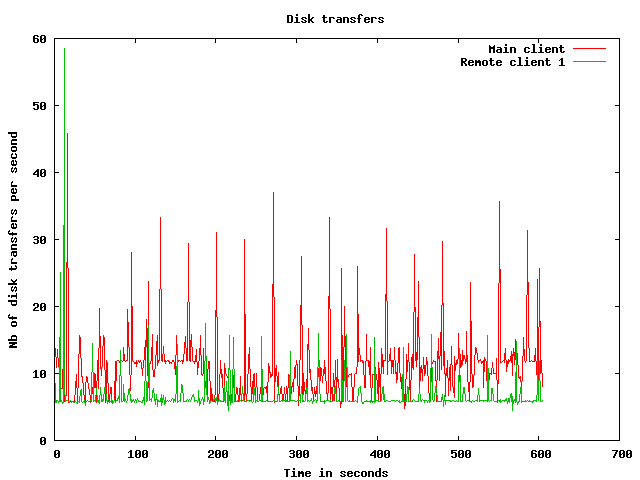
Disk usage graphs
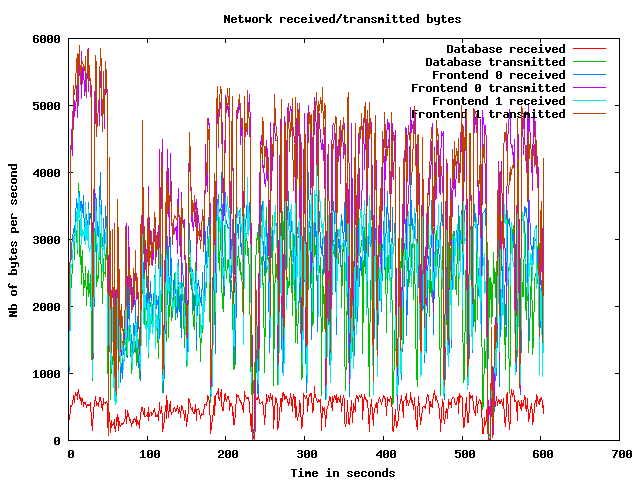
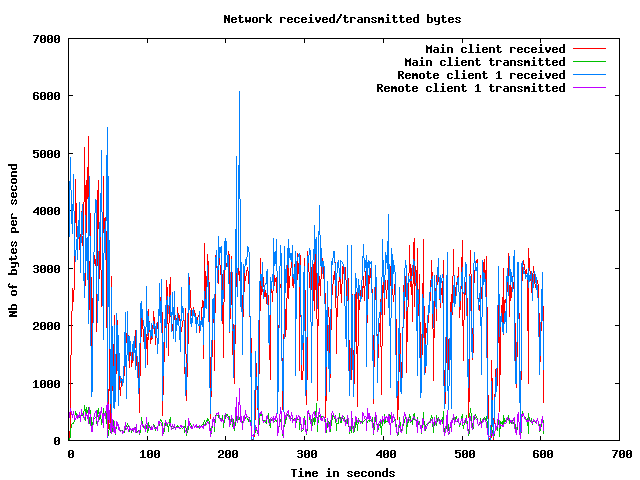
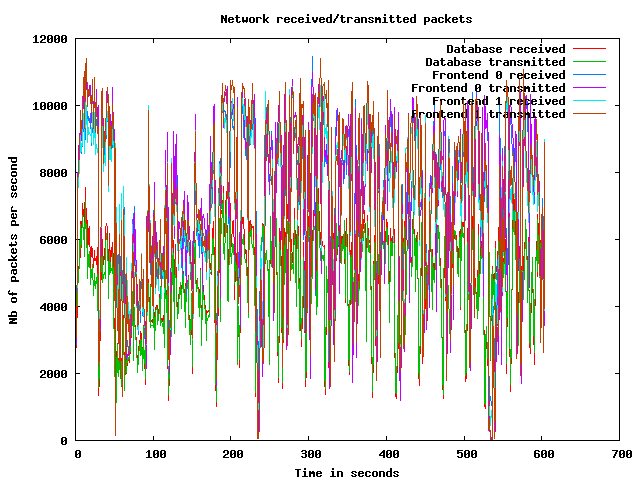
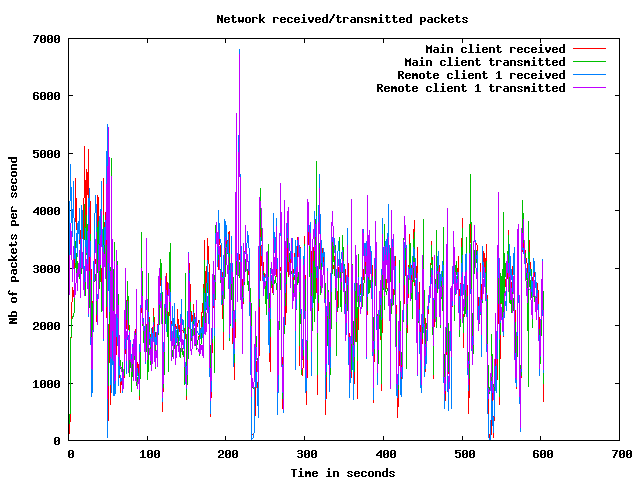
Network usage graphs
| Test start | 2009-3-20 5:3:9 |
| Up ramp start | 2009-3-20 5:3:59 |
| Runtime session start | 2009-3-20 5:5:59 |
| Down ramp start | 2009-3-20 5:13:29 |
| Test end | 2009-3-20 5:16:42 |
| Up ramp length | 2 minutes 17 milliseconds (requested 120000 ms) |
| Runtime session length | 7 minutes 30 seconds 0 millisecond (requested 450000 ms) |
| Down ramp length | 30 seconds 1 millisecond (requested 30000 ms) |
| Total test length | 13 minutes 33 seconds 26 milliseconds |
| State name | % of total | Count | Errors | Minimum Time | Maximum Time | Average Time |
|---|---|---|---|---|---|---|
Home | 9 % | 10343 | 0 | 0 ms | 121416 ms | 9799 ms
|
Register | 1 % | 1493 | 0 | 0 ms | 96317 ms | 3920 ms
|
RegisterUser | 1 % | 1390 | 69 | 4 ms | 93693 ms | 2802 ms
|
Browse | 9 % | 10694 | 0 | 0 ms | 96385 ms | 3991 ms
|
BrowseCategories | 6 % | 7085 | 0 | 3 ms | 96388 ms | 3352 ms
|
SearchItemsInCategory | 14 % | 16053 | 0 | 3 ms | 121591 ms | 2738 ms
|
BrowseRegions | 2 % | 2955 | 0 | 3 ms | 121615 ms | 3028 ms
|
BrowseCategoriesInRegion | 2 % | 2780 | 0 | 3 ms | 94390 ms | 3217 ms
|
SearchItemsInRegion | 5 % | 5602 | 0 | 0 ms | 121587 ms | 2688 ms
|
ViewItem | 12 % | 13835 | 0 | 3 ms | 115428 ms | 2639 ms
|
ViewUserInfo | 2 % | 2510 | 0 | 3 ms | 96403 ms | 2437 ms
|
ViewBidHistory | 1 % | 1312 | 0 | 3 ms | 96901 ms | 2501 ms
|
BuyNowAuth | 1 % | 1183 | 0 | 2 ms | 93822 ms | 2184 ms
|
BuyNow | 0 % | 1046 | 113 | 4 ms | 96548 ms | 2749 ms
|
StoreBuyBow | 0 % | 807 | 0 | 4 ms | 93085 ms | 1996 ms
|
PutBidAuth | 4 % | 4700 | 0 | 0 ms | 94210 ms | 2469 ms
|
PutBid | 4 % | 4653 | 506 | 3 ms | 96302 ms | 2454 ms
|
StoreBid | 2 % | 2744 | 2 | 4 ms | 94219 ms | 2691 ms
|
PutCommentAuth | 0 % | 0 | 0 | 0 ms | 0 ms | 0 ms
|
PutComment | 0 % | 405 | 24 | 3 ms | 93736 ms | 2376 ms
|
StoreComment | 0 % | 331 | 0 | 5 ms | 93453 ms | 2801 ms
|
Sell | 0 % | 807 | 0 | 0 ms | 94750 ms | 5096 ms
|
SelectCategoryToSellItem | 0 % | 761 | 0 | 3 ms | 95358 ms | 2432 ms
|
SellItemForm | 0 % | 720 | 0 | 2 ms | 93580 ms | 2648 ms
|
RegisterItem | 0 % | 652 | 0 | 4 ms | 94390 ms | 2959 ms
|
AboutMe (auth form) | 2 % | 2327 | 0 | 0 ms | 94365 ms | 4063 ms
|
AboutMe | 3 % | 3378 | 0 | 4 ms | 96539 ms | 3118 ms
|
Back probability | 8 % | 8891 | 0 | 0 ms | 0 ms | 0 ms
|
End of Session | 0 % | 1103 | 0 | 0 ms | 0 ms | 0 ms
|
Total | 100 % | 110560 | 714 | - | - | 3320 ms
|
Average throughput | 927 req/s
| |||||
Completed sessions | 993
| |||||
Total time | 56256 seconds
| |||||
Average session time | 56 seconds
| |||||
| State name | % of total | Count | Errors | Minimum Time | Maximum Time | Average Time |
|---|---|---|---|---|---|---|
Home | 4 % | 11703 | 0 | 0 ms | 383683 ms | 2759 ms
|
Register | 1 % | 2981 | 0 | 0 ms | 211773 ms | 4244 ms
|
RegisterUser | 1 % | 2919 | 177 | 5 ms | 283687 ms | 4737 ms
|
Browse | 7 % | 20325 | 0 | 0 ms | 383573 ms | 4533 ms
|
BrowseCategories | 4 % | 14167 | 0 | 3 ms | 389765 ms | 4581 ms
|
SearchItemsInCategory | 15 % | 44730 | 0 | 3 ms | 389759 ms | 4629 ms
|
BrowseRegions | 2 % | 5882 | 0 | 3 ms | 383565 ms | 4607 ms
|
BrowseCategoriesInRegion | 1 % | 5768 | 0 | 3 ms | 380015 ms | 4356 ms
|
SearchItemsInRegion | 5 % | 15549 | 0 | 0 ms | 383745 ms | 4704 ms
|
ViewItem | 14 % | 41129 | 0 | 3 ms | 389772 ms | 4574 ms
|
ViewUserInfo | 3 % | 9234 | 0 | 3 ms | 380128 ms | 4176 ms
|
ViewBidHistory | 1 % | 5112 | 0 | 3 ms | 380061 ms | 4694 ms
|
BuyNowAuth | 1 % | 3837 | 0 | 2 ms | 380007 ms | 4717 ms
|
BuyNow | 1 % | 3778 | 444 | 5 ms | 383757 ms | 4731 ms
|
StoreBuyBow | 1 % | 3276 | 5 | 5 ms | 473622 ms | 4819 ms
|
PutBidAuth | 4 % | 14430 | 0 | 0 ms | 383534 ms | 4332 ms
|
PutBid | 5 % | 16849 | 1629 | 4 ms | 383639 ms | 4646 ms
|
StoreBid | 3 % | 11188 | 16 | 5 ms | 383530 ms | 4669 ms
|
PutCommentAuth | 0 % | 0 | 0 | 0 ms | 0 ms | 0 ms
|
PutComment | 0 % | 1471 | 93 | 4 ms | 193459 ms | 3953 ms
|
StoreComment | 0 % | 1345 | 0 | 4 ms | 235051 ms | 5162 ms
|
Sell | 0 % | 1588 | 0 | 0 ms | 380001 ms | 4192 ms
|
SelectCategoryToSellItem | 0 % | 1560 | 0 | 4 ms | 235202 ms | 4469 ms
|
SellItemForm | 0 % | 1525 | 0 | 2 ms | 268875 ms | 5309 ms
|
RegisterItem | 0 % | 1500 | 0 | 4 ms | 383667 ms | 5006 ms
|
AboutMe (auth form) | 1 % | 4761 | 0 | 0 ms | 380036 ms | 4756 ms
|
AboutMe | 2 % | 7908 | 0 | 4 ms | 382609 ms | 4625 ms
|
Back probability | 10 % | 30359 | 0 | 0 ms | 0 ms | 0 ms
|
End of Session | 1 % | 4314 | 0 | 0 ms | 0 ms | 0 ms
|
Total | 100 % | 289188 | 2364 | - | - | 3927 ms
|
Average throughput | 647 req/s
| |||||
Completed sessions | 4342
| |||||
Total time | 1267097 seconds
| |||||
Average session time | 291 seconds
| |||||
| State name | % of total | Count | Errors | Minimum Time | Maximum Time | Average Time |
|---|---|---|---|---|---|---|
Home | 3 % | 507 | 0 | 0 ms | 235301 ms | 6311 ms
|
Register | 1 % | 149 | 0 | 0 ms | 190004 ms | 9912 ms
|
RegisterUser | 0 % | 135 | 11 | 5 ms | 235246 ms | 10207 ms
|
Browse | 6 % | 998 | 0 | 0 ms | 389751 ms | 13534 ms
|
BrowseCategories | 4 % | 676 | 0 | 3 ms | 283342 ms | 13909 ms
|
SearchItemsInCategory | 15 % | 2212 | 0 | 3 ms | 235310 ms | 12053 ms
|
BrowseRegions | 2 % | 292 | 0 | 3 ms | 190740 ms | 13183 ms
|
BrowseCategoriesInRegion | 2 % | 292 | 0 | 4 ms | 239102 ms | 13085 ms
|
SearchItemsInRegion | 5 % | 742 | 0 | 0 ms | 384447 ms | 11154 ms
|
ViewItem | 13 % | 1995 | 0 | 3 ms | 389847 ms | 12882 ms
|
ViewUserInfo | 3 % | 481 | 0 | 3 ms | 387408 ms | 16359 ms
|
ViewBidHistory | 1 % | 274 | 0 | 3 ms | 195001 ms | 11662 ms
|
BuyNowAuth | 1 % | 190 | 0 | 2 ms | 235256 ms | 10052 ms
|
BuyNow | 1 % | 180 | 18 | 6 ms | 211056 ms | 13503 ms
|
StoreBuyBow | 1 % | 180 | 0 | 4 ms | 283337 ms | 10293 ms
|
PutBidAuth | 5 % | 749 | 0 | 0 ms | 242362 ms | 12492 ms
|
PutBid | 6 % | 874 | 77 | 4 ms | 283420 ms | 11296 ms
|
StoreBid | 3 % | 578 | 0 | 5 ms | 199485 ms | 8609 ms
|
PutCommentAuth | 0 % | 0 | 0 | 0 ms | 0 ms | 0 ms
|
PutComment | 0 % | 68 | 0 | 5 ms | 235200 ms | 20871 ms
|
StoreComment | 0 % | 74 | 0 | 5 ms | 190017 ms | 8800 ms
|
Sell | 0 % | 74 | 0 | 0 ms | 190003 ms | 13165 ms
|
SelectCategoryToSellItem | 0 % | 79 | 0 | 4 ms | 93361 ms | 5751 ms
|
SellItemForm | 0 % | 70 | 0 | 2 ms | 239160 ms | 20781 ms
|
RegisterItem | 0 % | 81 | 0 | 5 ms | 189996 ms | 5766 ms
|
AboutMe (auth form) | 1 % | 233 | 0 | 0 ms | 235248 ms | 10175 ms
|
AboutMe | 2 % | 376 | 0 | 4 ms | 241840 ms | 12479 ms
|
Back probability | 11 % | 1703 | 0 | 0 ms | 0 ms | 0 ms
|
End of Session | 1 % | 231 | 0 | 0 ms | 0 ms | 0 ms
|
Total | 100 % | 14493 | 106 | - | - | 10358 ms
|
Average throughput | 486 req/s
| |||||
Completed sessions | 202
| |||||
Total time | 86042 seconds
| |||||
Average session time | 425 seconds
| |||||
| State name | % of total | Count | Errors | Minimum Time | Maximum Time | Average Time |
|---|---|---|---|---|---|---|
Home | 5 % | 22554 | 0 | 0 ms | 383683 ms | 6220 ms
|
Register | 1 % | 4631 | 0 | 0 ms | 211773 ms | 4662 ms
|
RegisterUser | 1 % | 4453 | 257 | 4 ms | 283687 ms | 4694 ms
|
Browse | 7 % | 32080 | 0 | 0 ms | 389751 ms | 5032 ms
|
BrowseCategories | 5 % | 21983 | 0 | 3 ms | 389765 ms | 4776 ms
|
SearchItemsInCategory | 15 % | 63482 | 0 | 3 ms | 389759 ms | 4752 ms
|
BrowseRegions | 2 % | 9145 | 0 | 3 ms | 383565 ms | 4740 ms
|
BrowseCategoriesInRegion | 2 % | 8861 | 0 | 3 ms | 380015 ms | 4586 ms
|
SearchItemsInRegion | 5 % | 22040 | 0 | 0 ms | 384447 ms | 4728 ms
|
ViewItem | 13 % | 57222 | 0 | 3 ms | 389847 ms | 4827 ms
|
ViewUserInfo | 2 % | 12306 | 0 | 3 ms | 387408 ms | 4715 ms
|
ViewBidHistory | 1 % | 6739 | 0 | 3 ms | 380188 ms | 5064 ms
|
BuyNowAuth | 1 % | 5221 | 0 | 2 ms | 380049 ms | 4927 ms
|
BuyNow | 1 % | 5021 | 575 | 4 ms | 383757 ms | 5335 ms
|
StoreBuyBow | 1 % | 4279 | 5 | 4 ms | 473622 ms | 5009 ms
|
PutBidAuth | 4 % | 19925 | 0 | 0 ms | 383534 ms | 4555 ms
|
PutBid | 5 % | 22521 | 2213 | 3 ms | 383639 ms | 4909 ms
|
StoreBid | 3 % | 14556 | 18 | 4 ms | 383530 ms | 4858 ms
|
PutCommentAuth | 0 % | 0 | 0 | 0 ms | 0 ms | 0 ms
|
PutComment | 0 % | 1949 | 117 | 3 ms | 235200 ms | 4595 ms
|
StoreComment | 0 % | 1754 | 0 | 4 ms | 380078 ms | 5400 ms
|
Sell | 0 % | 2472 | 0 | 0 ms | 380001 ms | 5135 ms
|
SelectCategoryToSellItem | 0 % | 2405 | 0 | 3 ms | 235202 ms | 4173 ms
|
SellItemForm | 0 % | 2319 | 0 | 2 ms | 380080 ms | 5615 ms
|
RegisterItem | 0 % | 2240 | 0 | 4 ms | 383667 ms | 4931 ms
|
AboutMe (auth form) | 1 % | 7335 | 0 | 0 ms | 380062 ms | 5165 ms
|
AboutMe | 2 % | 11775 | 0 | 4 ms | 382609 ms | 4717 ms
|
Back probability | 9 % | 41054 | 0 | 0 ms | 0 ms | 0 ms
|
End of Session | 1 % | 5660 | 0 | 0 ms | 0 ms | 0 ms
|
Total | 100 % | 415982 | 3185 | - | - | 4323 ms
|
Average throughput | 698 req/s
| |||||
Completed sessions | 5660
| |||||
Total time | 1468220 seconds
| |||||
Average session time | 259 seconds
| |||||
An error occured while waiting for remote processes termination (Skipping waits)
Command is: /usr/bin/scp farm6.csail.mit.edu:/tmp/client1 /home/drkp/sandbox/txcache/src/RUBiS-1.4.3/bench/2009-3-20@5:3:9//client1.bin
Command is: /usr/bin/ssh -x localhost /bin/bash -c 'LANG=en_GB.UTF-8 /usr/bin/sar -n DEV -n SOCK -rubcw 1 605 -f /home/drkp/sandbox/txcache/src/RUBiS-1.4.3/bench/2009-3-20@5:3:9//client1.bin > /home/drkp/sandbox/txcache/src/RUBiS-1.4.3/bench/2009-3-20@5:3:9//client1'
Command is: /usr/bin/scp farm14:/tmp/db_server0 /home/drkp/sandbox/txcache/src/RUBiS-1.4.3/bench/2009-3-20@5:3:9//db_server0.bin
Command is: /usr/bin/ssh -x localhost /bin/bash -c 'LANG=en_GB.UTF-8 /usr/bin/sar -n DEV -n SOCK -rubcw 1 605 -f /home/drkp/sandbox/txcache/src/RUBiS-1.4.3/bench/2009-3-20@5:3:9//db_server0.bin > /home/drkp/sandbox/txcache/src/RUBiS-1.4.3/bench/2009-3-20@5:3:9//db_server0'
Command is: /usr/bin/scp farm12.csail.mit.edu:/tmp/web_server0 /home/drkp/sandbox/txcache/src/RUBiS-1.4.3/bench/2009-3-20@5:3:9//web_server0.bin
Command is: /usr/bin/ssh -x localhost /bin/bash -c 'LANG=en_GB.UTF-8 /usr/bin/sar -n DEV -n SOCK -rubcw 1 605 -f /home/drkp/sandbox/txcache/src/RUBiS-1.4.3/bench/2009-3-20@5:3:9//web_server0.bin > /home/drkp/sandbox/txcache/src/RUBiS-1.4.3/bench/2009-3-20@5:3:9//web_server0'
Command is: /usr/bin/scp farm13.csail.mit.edu:/tmp/web_server1 /home/drkp/sandbox/txcache/src/RUBiS-1.4.3/bench/2009-3-20@5:3:9//web_server1.bin
Command is: /usr/bin/ssh -x localhost /bin/bash -c 'LANG=en_GB.UTF-8 /usr/bin/sar -n DEV -n SOCK -rubcw 1 605 -f /home/drkp/sandbox/txcache/src/RUBiS-1.4.3/bench/2009-3-20@5:3:9//web_server1.bin > /home/drkp/sandbox/txcache/src/RUBiS-1.4.3/bench/2009-3-20@5:3:9//web_server1'
Command is: /usr/bin/scp localhost:/tmp/client0 /home/drkp/sandbox/txcache/src/RUBiS-1.4.3/bench/2009-3-20@5:3:9//client0.bin
Command is: /usr/bin/ssh -x localhost /bin/bash -c 'LANG=en_GB.UTF-8 /usr/bin/sar -n DEV -n SOCK -rubcw 1 605 -f /home/drkp/sandbox/txcache/src/RUBiS-1.4.3/bench/2009-3-20@5:3:9//client0.bin > /home/drkp/sandbox/txcache/src/RUBiS-1.4.3/bench/2009-3-20@5:3:9//client0'
Command is: /usr/bin/scp farm6.csail.mit.edu:/tmp/trace_client1.html /home/drkp/sandbox/txcache/src/RUBiS-1.4.3/bench/2009-3-20@5:3:9//
Command is: /usr/bin/scp farm6.csail.mit.edu:/tmp/stat_client1.html /home/drkp/sandbox/txcache/src/RUBiS-1.4.3/bench/2009-3-20@5:3:9//
|
|
|
|
|
|
 | 
|
 | 
|
 | 
|
 | 
|
 | 
|
 | 
|
 | 
|
 | 
|
 | 
|