Node information
Test timing information
Up ramp statistics
Runtime session statistics
Down ramp statistics
Overall statistics
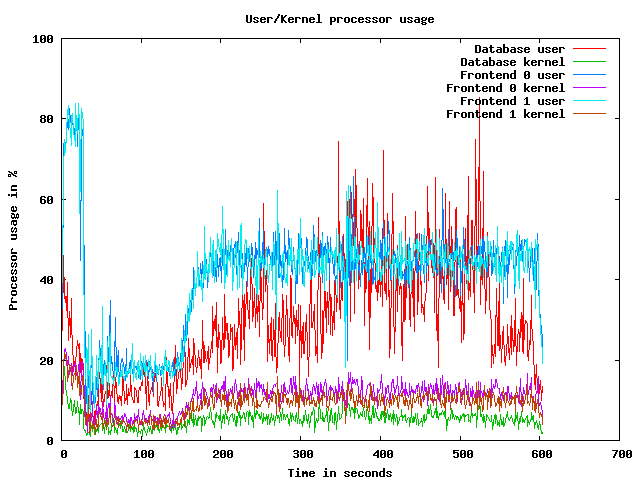
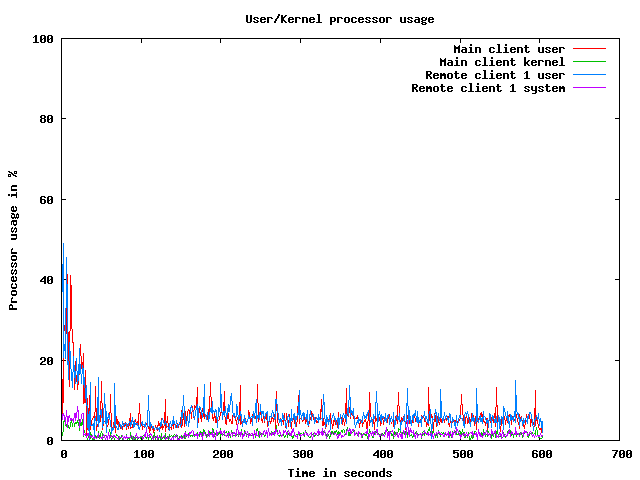
CPU usage graphs
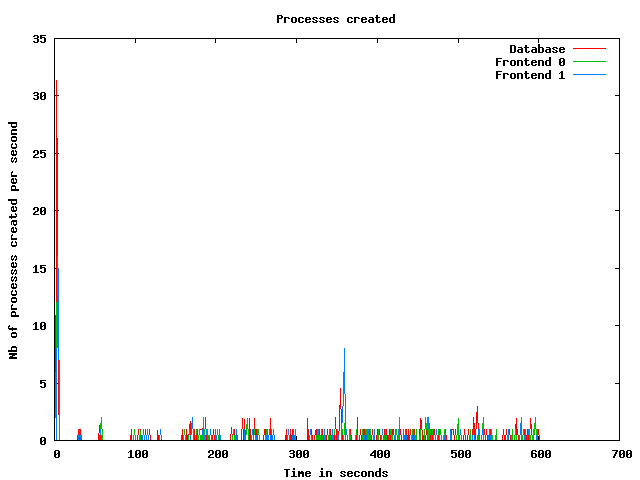
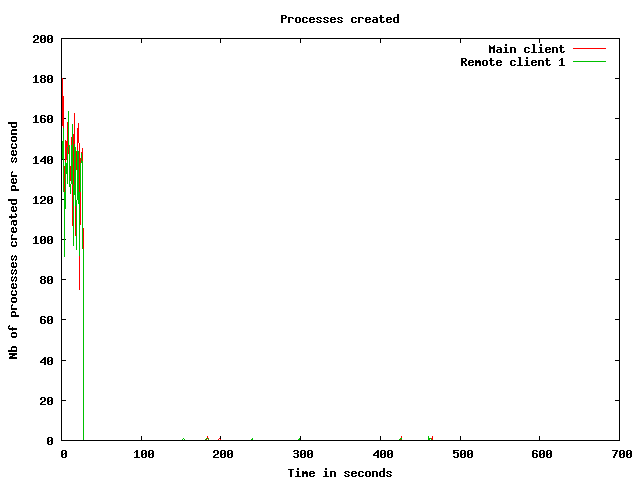
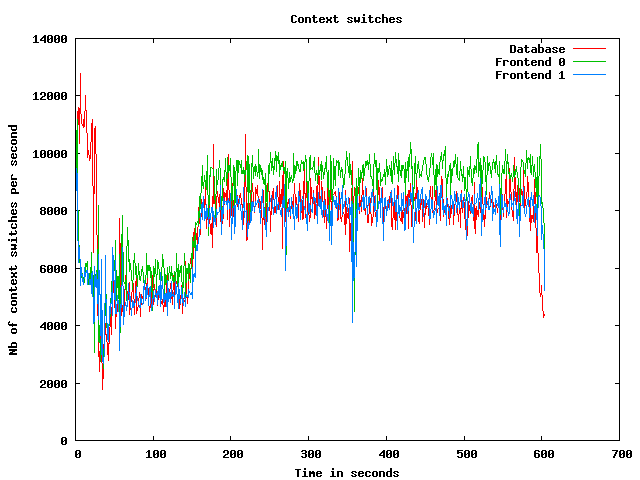
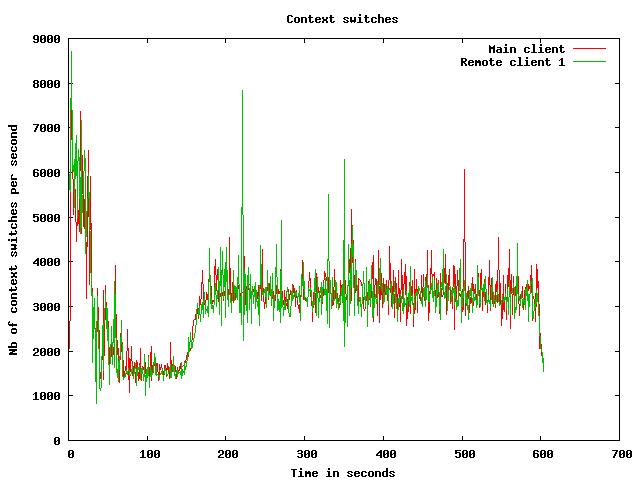
Processes usage graphs
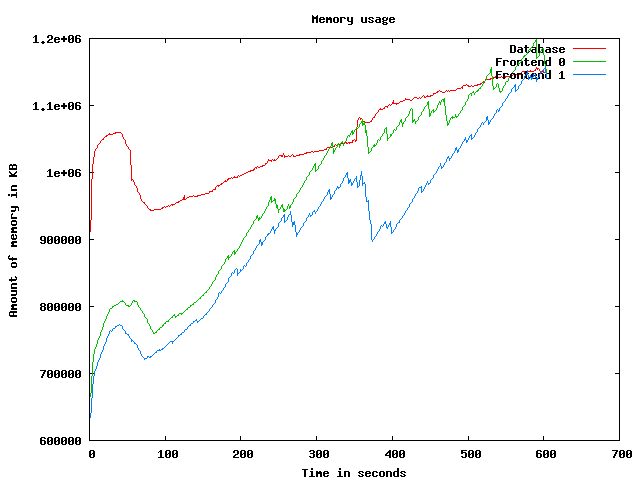
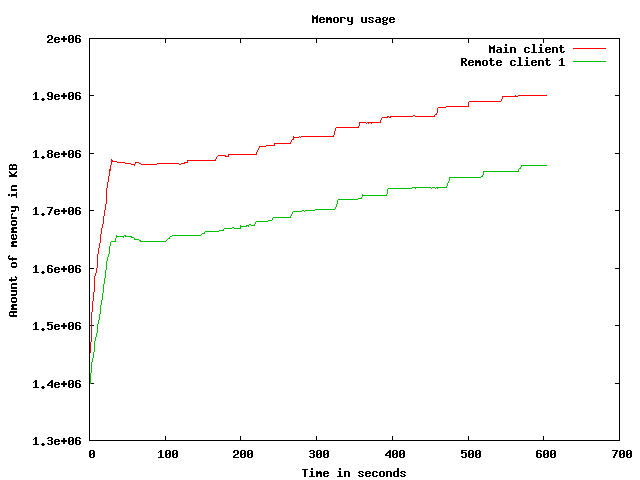
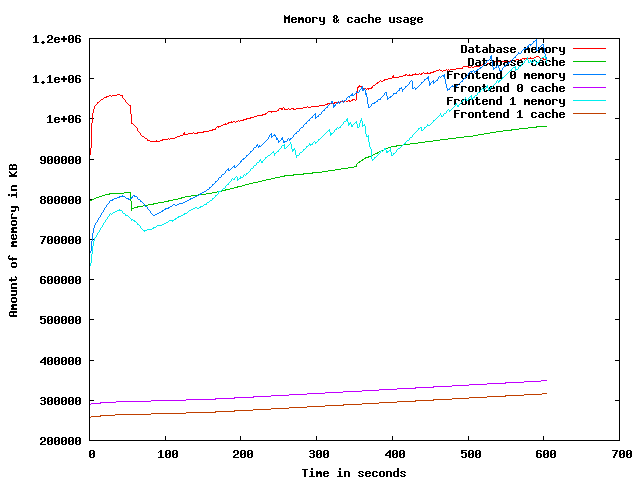
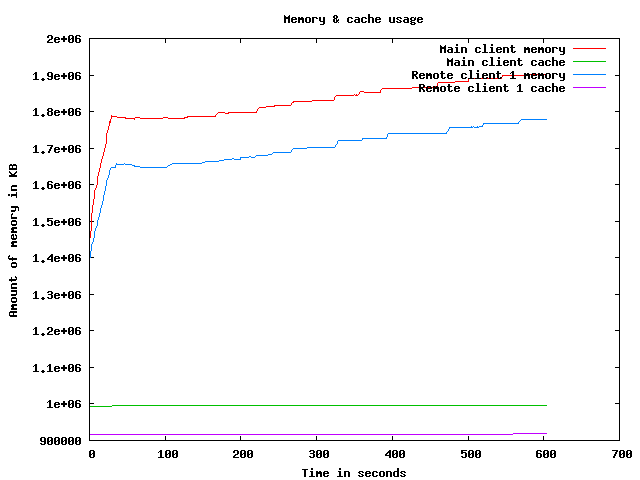
Memory usage graph
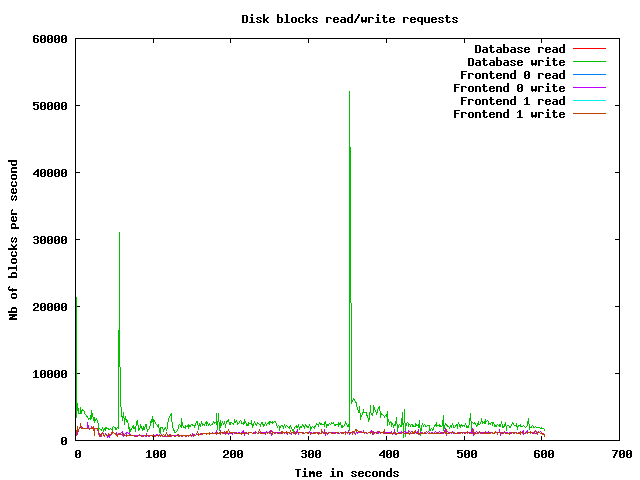
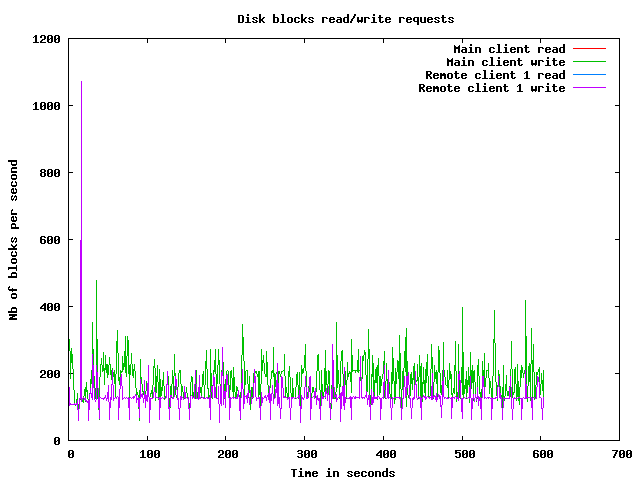
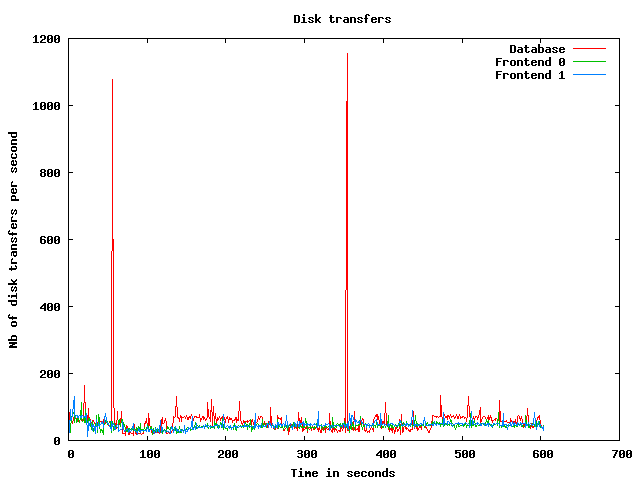
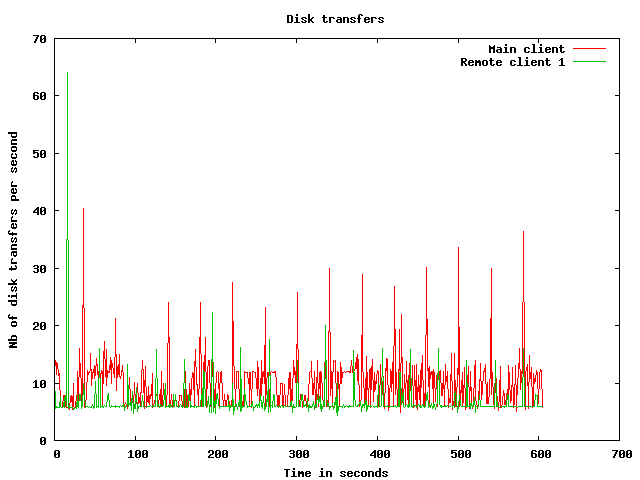
Disk usage graphs
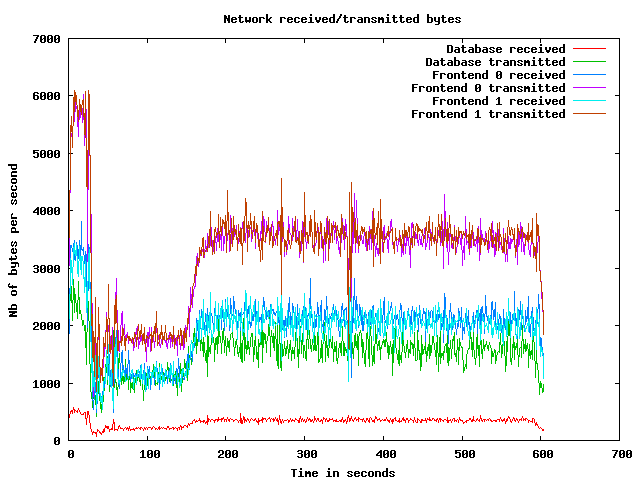
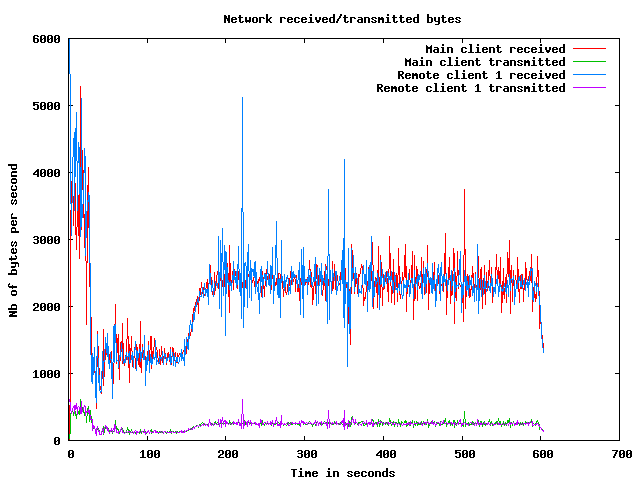
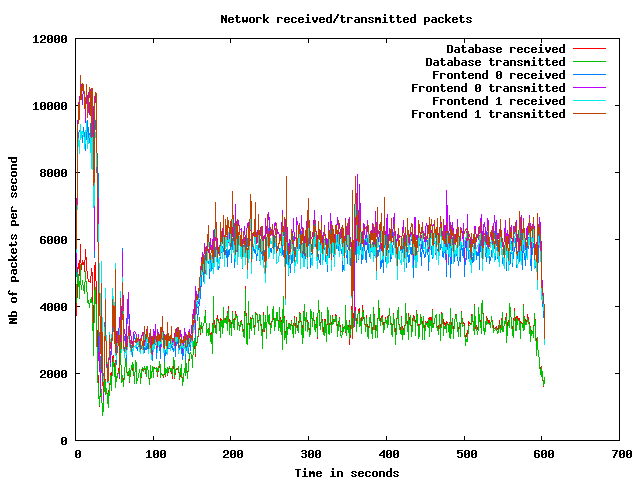
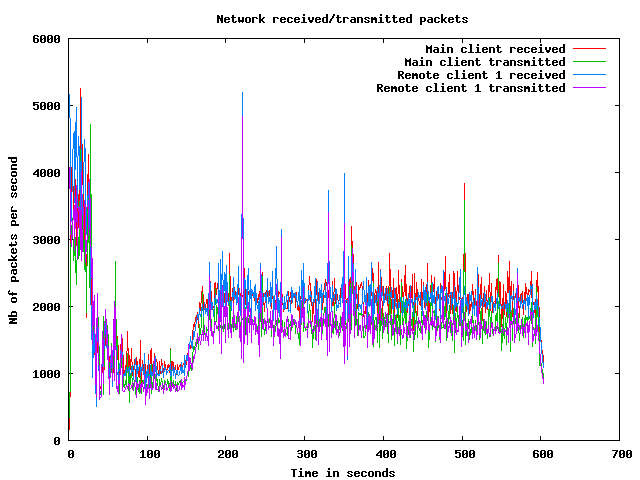
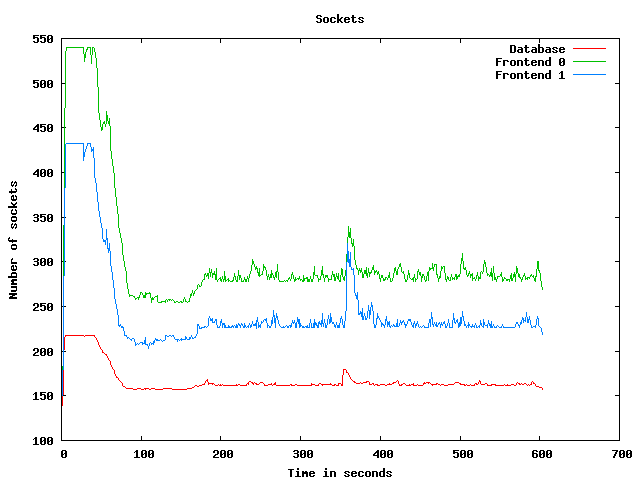
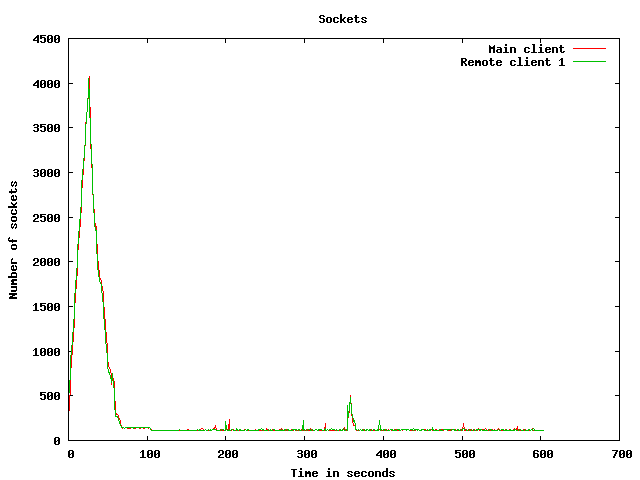
Network usage graphs
| Test start | 2009-3-20 3:41:4 |
| Up ramp start | 2009-3-20 3:41:33 |
| Runtime session start | 2009-3-20 3:43:33 |
| Down ramp start | 2009-3-20 3:51:3 |
| Test end | 2009-3-20 3:53:36 |
| Up ramp length | 2 minutes 0 millisecond (requested 120000 ms) |
| Runtime session length | 7 minutes 30 seconds 1 millisecond (requested 450000 ms) |
| Down ramp length | 30 seconds 0 millisecond (requested 30000 ms) |
| Total test length | 12 minutes 31 seconds 332 milliseconds |
| State name | % of total | Count | Errors | Minimum Time | Maximum Time | Average Time |
|---|---|---|---|---|---|---|
Home | 9 % | 6504 | 0 | 0 ms | 92991 ms | 4595 ms
|
Register | 1 % | 866 | 0 | 0 ms | 45609 ms | 1458 ms
|
RegisterUser | 1 % | 808 | 1 | 5 ms | 93017 ms | 1813 ms
|
Browse | 9 % | 6557 | 0 | 0 ms | 92992 ms | 1998 ms
|
BrowseCategories | 6 % | 4417 | 0 | 3 ms | 93005 ms | 1638 ms
|
SearchItemsInCategory | 15 % | 10547 | 0 | 0 ms | 93013 ms | 1355 ms
|
BrowseRegions | 2 % | 1769 | 0 | 3 ms | 93003 ms | 1710 ms
|
BrowseCategoriesInRegion | 2 % | 1639 | 0 | 3 ms | 45643 ms | 1604 ms
|
SearchItemsInRegion | 4 % | 3234 | 0 | 0 ms | 93011 ms | 1228 ms
|
ViewItem | 12 % | 8895 | 0 | 3 ms | 92999 ms | 1236 ms
|
ViewUserInfo | 2 % | 1641 | 0 | 3 ms | 45307 ms | 940 ms
|
ViewBidHistory | 1 % | 761 | 0 | 3 ms | 45667 ms | 1038 ms
|
BuyNowAuth | 1 % | 768 | 0 | 2 ms | 45343 ms | 1360 ms
|
BuyNow | 1 % | 703 | 117 | 5 ms | 45168 ms | 935 ms
|
StoreBuyBow | 0 % | 496 | 0 | 4 ms | 93006 ms | 1002 ms
|
PutBidAuth | 4 % | 2932 | 0 | 0 ms | 46572 ms | 1167 ms
|
PutBid | 4 % | 2843 | 374 | 3 ms | 59264 ms | 1075 ms
|
StoreBid | 2 % | 1638 | 1 | 4 ms | 93010 ms | 1177 ms
|
PutCommentAuth | 0 % | 0 | 0 | 0 ms | 0 ms | 0 ms
|
PutComment | 0 % | 248 | 25 | 4 ms | 45141 ms | 1153 ms
|
StoreComment | 0 % | 202 | 0 | 4 ms | 46555 ms | 1570 ms
|
Sell | 0 % | 472 | 0 | 0 ms | 45545 ms | 1805 ms
|
SelectCategoryToSellItem | 0 % | 439 | 0 | 3 ms | 45638 ms | 1741 ms
|
SellItemForm | 0 % | 411 | 0 | 2 ms | 59105 ms | 2034 ms
|
RegisterItem | 0 % | 382 | 0 | 4 ms | 45027 ms | 1857 ms
|
AboutMe (auth form) | 2 % | 1473 | 0 | 0 ms | 93003 ms | 2489 ms
|
AboutMe | 2 % | 2065 | 0 | 4 ms | 93015 ms | 1586 ms
|
Back probability | 8 % | 5567 | 0 | 0 ms | 0 ms | 0 ms
|
End of Session | 1 % | 703 | 0 | 0 ms | 0 ms | 0 ms
|
Total | 100 % | 68980 | 518 | - | - | 1604 ms
|
Average throughput | 579 req/s
| |||||
Completed sessions | 640
| |||||
Total time | 35010 seconds
| |||||
Average session time | 54 seconds
| |||||
| State name | % of total | Count | Errors | Minimum Time | Maximum Time | Average Time |
|---|---|---|---|---|---|---|
Home | 4 % | 13150 | 0 | 0 ms | 3085 ms | 2 ms
|
Register | 1 % | 3078 | 0 | 0 ms | 9279 ms | 13 ms
|
RegisterUser | 1 % | 3016 | 24 | 5 ms | 9315 ms | 25 ms
|
Browse | 7 % | 21252 | 0 | 0 ms | 9311 ms | 9 ms
|
BrowseCategories | 5 % | 14917 | 0 | 3 ms | 9146 ms | 16 ms
|
SearchItemsInCategory | 15 % | 46803 | 0 | 0 ms | 9330 ms | 18 ms
|
BrowseRegions | 2 % | 6039 | 0 | 3 ms | 9308 ms | 21 ms
|
BrowseCategoriesInRegion | 2 % | 5954 | 0 | 3 ms | 9204 ms | 21 ms
|
SearchItemsInRegion | 4 % | 14566 | 0 | 0 ms | 9147 ms | 34 ms
|
ViewItem | 14 % | 42085 | 0 | 3 ms | 9328 ms | 22 ms
|
ViewUserInfo | 3 % | 9510 | 0 | 3 ms | 9329 ms | 23 ms
|
ViewBidHistory | 1 % | 5040 | 0 | 3 ms | 9076 ms | 28 ms
|
BuyNowAuth | 1 % | 3892 | 0 | 2 ms | 3459 ms | 11 ms
|
BuyNow | 1 % | 3834 | 556 | 4 ms | 9342 ms | 25 ms
|
StoreBuyBow | 1 % | 3245 | 0 | 5 ms | 3705 ms | 19 ms
|
PutBidAuth | 4 % | 14622 | 0 | 0 ms | 9320 ms | 16 ms
|
PutBid | 5 % | 16731 | 1980 | 3 ms | 9205 ms | 25 ms
|
StoreBid | 3 % | 10950 | 4 | 4 ms | 9213 ms | 25 ms
|
PutCommentAuth | 0 % | 0 | 0 | 0 ms | 0 ms | 0 ms
|
PutComment | 0 % | 1439 | 110 | 4 ms | 9051 ms | 27 ms
|
StoreComment | 0 % | 1309 | 0 | 4 ms | 869 ms | 18 ms
|
Sell | 0 % | 1638 | 0 | 0 ms | 3311 ms | 7 ms
|
SelectCategoryToSellItem | 0 % | 1617 | 0 | 3 ms | 876 ms | 16 ms
|
SellItemForm | 0 % | 1575 | 0 | 2 ms | 3530 ms | 13 ms
|
RegisterItem | 0 % | 1542 | 0 | 4 ms | 9023 ms | 28 ms
|
AboutMe (auth form) | 1 % | 4896 | 0 | 0 ms | 3633 ms | 6 ms
|
AboutMe | 2 % | 8273 | 0 | 4 ms | 9041 ms | 38 ms
|
Back probability | 10 % | 30830 | 0 | 0 ms | 0 ms | 0 ms
|
End of Session | 1 % | 4215 | 0 | 0 ms | 0 ms | 0 ms
|
Total | 100 % | 296018 | 2674 | - | - | 17 ms
|
Average throughput | 663 req/s
| |||||
Completed sessions | 4217
| |||||
Total time | 1070573 seconds
| |||||
Average session time | 253 seconds
| |||||
| State name | % of total | Count | Errors | Minimum Time | Maximum Time | Average Time |
|---|---|---|---|---|---|---|
Home | 4 % | 444 | 0 | 0 ms | 15 ms | 0 ms
|
Register | 0 % | 95 | 0 | 0 ms | 5 ms | 1 ms
|
RegisterUser | 1 % | 104 | 1 | 5 ms | 37 ms | 10 ms
|
Browse | 7 % | 692 | 0 | 0 ms | 17 ms | 1 ms
|
BrowseCategories | 4 % | 490 | 0 | 3 ms | 35 ms | 7 ms
|
SearchItemsInCategory | 15 % | 1546 | 0 | 1 ms | 50 ms | 7 ms
|
BrowseRegions | 2 % | 201 | 0 | 3 ms | 54 ms | 7 ms
|
BrowseCategoriesInRegion | 2 % | 202 | 0 | 3 ms | 44 ms | 7 ms
|
SearchItemsInRegion | 5 % | 511 | 0 | 0 ms | 138 ms | 14 ms
|
ViewItem | 13 % | 1369 | 0 | 3 ms | 113 ms | 9 ms
|
ViewUserInfo | 3 % | 302 | 0 | 3 ms | 45 ms | 9 ms
|
ViewBidHistory | 1 % | 169 | 0 | 3 ms | 128 ms | 18 ms
|
BuyNowAuth | 1 % | 130 | 0 | 2 ms | 27 ms | 3 ms
|
BuyNow | 1 % | 109 | 14 | 5 ms | 35 ms | 11 ms
|
StoreBuyBow | 0 % | 97 | 0 | 4 ms | 44 ms | 11 ms
|
PutBidAuth | 4 % | 486 | 0 | 0 ms | 47 ms | 4 ms
|
PutBid | 5 % | 555 | 81 | 3 ms | 53 ms | 12 ms
|
StoreBid | 3 % | 361 | 0 | 4 ms | 44 ms | 10 ms
|
PutCommentAuth | 0 % | 0 | 0 | 0 ms | 0 ms | 0 ms
|
PutComment | 0 % | 49 | 4 | 4 ms | 24 ms | 9 ms
|
StoreComment | 0 % | 43 | 0 | 5 ms | 20 ms | 9 ms
|
Sell | 0 % | 68 | 0 | 0 ms | 5 ms | 0 ms
|
SelectCategoryToSellItem | 0 % | 55 | 0 | 3 ms | 27 ms | 9 ms
|
SellItemForm | 0 % | 60 | 0 | 2 ms | 48 ms | 5 ms
|
RegisterItem | 0 % | 52 | 0 | 4 ms | 16 ms | 9 ms
|
AboutMe (auth form) | 1 % | 163 | 0 | 0 ms | 8 ms | 1 ms
|
AboutMe | 2 % | 292 | 0 | 4 ms | 69 ms | 21 ms
|
Back probability | 10 % | 1016 | 0 | 0 ms | 0 ms | 0 ms
|
End of Session | 1 % | 163 | 0 | 0 ms | 0 ms | 0 ms
|
Total | 100 % | 9824 | 100 | - | - | 7 ms
|
Average throughput | 330 req/s
| |||||
Completed sessions | 139
| |||||
Total time | 41697 seconds
| |||||
Average session time | 299 seconds
| |||||
| State name | % of total | Count | Errors | Minimum Time | Maximum Time | Average Time |
|---|---|---|---|---|---|---|
Home | 5 % | 20099 | 0 | 0 ms | 92991 ms | 1489 ms
|
Register | 1 % | 4039 | 0 | 0 ms | 45609 ms | 323 ms
|
RegisterUser | 1 % | 3928 | 26 | 5 ms | 93017 ms | 393 ms
|
Browse | 7 % | 28501 | 0 | 0 ms | 92992 ms | 466 ms
|
BrowseCategories | 5 % | 19824 | 0 | 3 ms | 93005 ms | 377 ms
|
SearchItemsInCategory | 15 % | 59097 | 0 | 0 ms | 93013 ms | 256 ms
|
BrowseRegions | 2 % | 8009 | 0 | 3 ms | 93003 ms | 394 ms
|
BrowseCategoriesInRegion | 2 % | 7795 | 0 | 3 ms | 45643 ms | 353 ms
|
SearchItemsInRegion | 4 % | 18361 | 0 | 0 ms | 93011 ms | 244 ms
|
ViewItem | 13 % | 52445 | 0 | 3 ms | 92999 ms | 227 ms
|
ViewUserInfo | 3 % | 11478 | 0 | 3 ms | 45307 ms | 153 ms
|
ViewBidHistory | 1 % | 5983 | 0 | 3 ms | 45667 ms | 156 ms
|
BuyNowAuth | 1 % | 4790 | 0 | 2 ms | 45343 ms | 227 ms
|
BuyNow | 1 % | 4646 | 687 | 4 ms | 45168 ms | 162 ms
|
StoreBuyBow | 1 % | 3838 | 0 | 4 ms | 93006 ms | 146 ms
|
PutBidAuth | 4 % | 18040 | 0 | 0 ms | 46572 ms | 203 ms
|
PutBid | 5 % | 20171 | 2436 | 3 ms | 59264 ms | 173 ms
|
StoreBid | 3 % | 12949 | 5 | 4 ms | 93010 ms | 170 ms
|
PutCommentAuth | 0 % | 0 | 0 | 0 ms | 0 ms | 0 ms
|
PutComment | 0 % | 1736 | 139 | 4 ms | 45141 ms | 187 ms
|
StoreComment | 0 % | 1554 | 0 | 4 ms | 46555 ms | 220 ms
|
Sell | 0 % | 2178 | 0 | 0 ms | 45545 ms | 396 ms
|
SelectCategoryToSellItem | 0 % | 2111 | 0 | 3 ms | 45638 ms | 374 ms
|
SellItemForm | 0 % | 2046 | 0 | 2 ms | 59105 ms | 419 ms
|
RegisterItem | 0 % | 1976 | 0 | 4 ms | 45027 ms | 381 ms
|
AboutMe (auth form) | 1 % | 6532 | 0 | 0 ms | 93003 ms | 566 ms
|
AboutMe | 2 % | 10682 | 0 | 4 ms | 93015 ms | 336 ms
|
Back probability | 9 % | 37413 | 0 | 0 ms | 0 ms | 0 ms
|
End of Session | 1 % | 5081 | 0 | 0 ms | 0 ms | 0 ms
|
Total | 100 % | 375302 | 3293 | - | - | 308 ms
|
Average throughput | 630 req/s
| |||||
Completed sessions | 5081
| |||||
Total time | 1178733 seconds
| |||||
Average session time | 231 seconds
| |||||
An error occured while waiting for remote processes termination (Skipping waits)
Command is: /usr/bin/scp farm6.csail.mit.edu:/tmp/client1 /home/drkp/sandbox/txcache/src/RUBiS-1.4.3/bench/2009-3-20@3:41:4//client1.bin
Command is: /usr/bin/ssh -x localhost /bin/bash -c 'LANG=en_GB.UTF-8 /usr/bin/sar -n DEV -n SOCK -rubcw 1 605 -f /home/drkp/sandbox/txcache/src/RUBiS-1.4.3/bench/2009-3-20@3:41:4//client1.bin > /home/drkp/sandbox/txcache/src/RUBiS-1.4.3/bench/2009-3-20@3:41:4//client1'
Command is: /usr/bin/scp farm14:/tmp/db_server0 /home/drkp/sandbox/txcache/src/RUBiS-1.4.3/bench/2009-3-20@3:41:4//db_server0.bin
Command is: /usr/bin/ssh -x localhost /bin/bash -c 'LANG=en_GB.UTF-8 /usr/bin/sar -n DEV -n SOCK -rubcw 1 605 -f /home/drkp/sandbox/txcache/src/RUBiS-1.4.3/bench/2009-3-20@3:41:4//db_server0.bin > /home/drkp/sandbox/txcache/src/RUBiS-1.4.3/bench/2009-3-20@3:41:4//db_server0'
Command is: /usr/bin/scp farm12.csail.mit.edu:/tmp/web_server0 /home/drkp/sandbox/txcache/src/RUBiS-1.4.3/bench/2009-3-20@3:41:4//web_server0.bin
Command is: /usr/bin/ssh -x localhost /bin/bash -c 'LANG=en_GB.UTF-8 /usr/bin/sar -n DEV -n SOCK -rubcw 1 605 -f /home/drkp/sandbox/txcache/src/RUBiS-1.4.3/bench/2009-3-20@3:41:4//web_server0.bin > /home/drkp/sandbox/txcache/src/RUBiS-1.4.3/bench/2009-3-20@3:41:4//web_server0'
Command is: /usr/bin/scp farm13.csail.mit.edu:/tmp/web_server1 /home/drkp/sandbox/txcache/src/RUBiS-1.4.3/bench/2009-3-20@3:41:4//web_server1.bin
Command is: /usr/bin/ssh -x localhost /bin/bash -c 'LANG=en_GB.UTF-8 /usr/bin/sar -n DEV -n SOCK -rubcw 1 605 -f /home/drkp/sandbox/txcache/src/RUBiS-1.4.3/bench/2009-3-20@3:41:4//web_server1.bin > /home/drkp/sandbox/txcache/src/RUBiS-1.4.3/bench/2009-3-20@3:41:4//web_server1'
Command is: /usr/bin/scp localhost:/tmp/client0 /home/drkp/sandbox/txcache/src/RUBiS-1.4.3/bench/2009-3-20@3:41:4//client0.bin
Command is: /usr/bin/ssh -x localhost /bin/bash -c 'LANG=en_GB.UTF-8 /usr/bin/sar -n DEV -n SOCK -rubcw 1 605 -f /home/drkp/sandbox/txcache/src/RUBiS-1.4.3/bench/2009-3-20@3:41:4//client0.bin > /home/drkp/sandbox/txcache/src/RUBiS-1.4.3/bench/2009-3-20@3:41:4//client0'
Command is: /usr/bin/scp farm6.csail.mit.edu:/tmp/trace_client1.html /home/drkp/sandbox/txcache/src/RUBiS-1.4.3/bench/2009-3-20@3:41:4//
Command is: /usr/bin/scp farm6.csail.mit.edu:/tmp/stat_client1.html /home/drkp/sandbox/txcache/src/RUBiS-1.4.3/bench/2009-3-20@3:41:4//
|
|
|
|
|
|
 | 
|
 | 
|
 | 
|
 | 
|
 | 
|
 | 
|
 | 
|
 | 
|
 | 
|