Node information
Test timing information
Up ramp statistics
Runtime session statistics
Down ramp statistics
Overall statistics
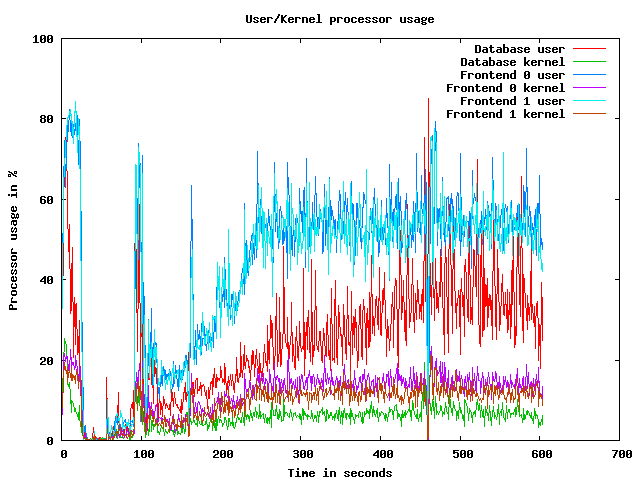
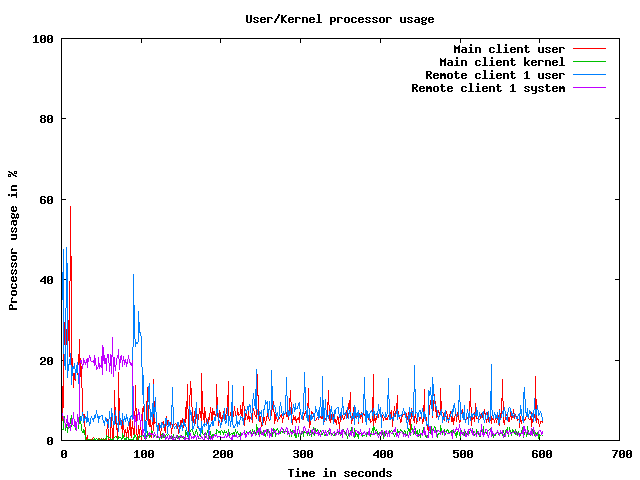
CPU usage graphs
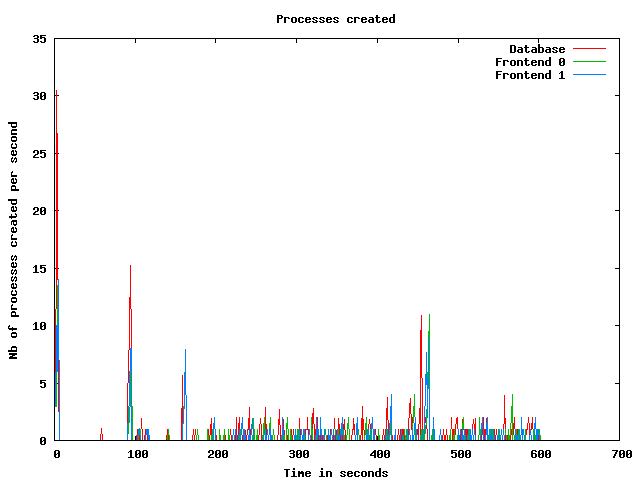
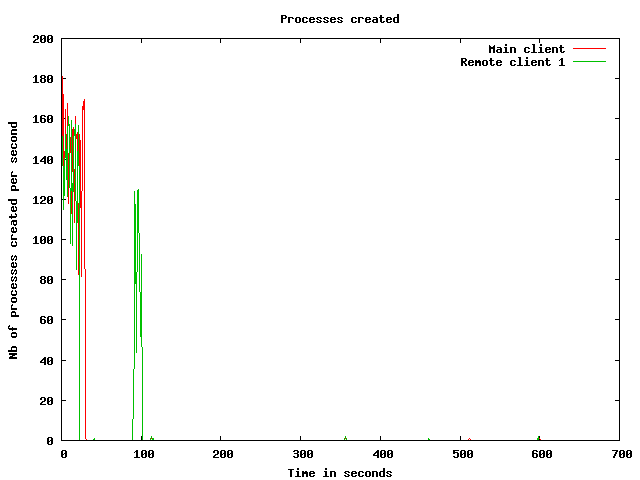
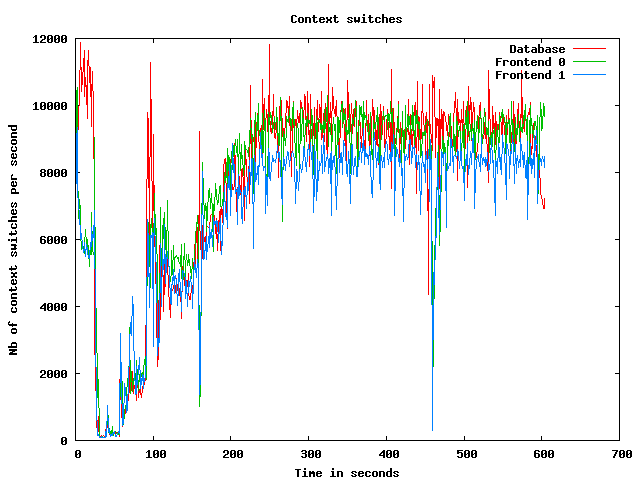
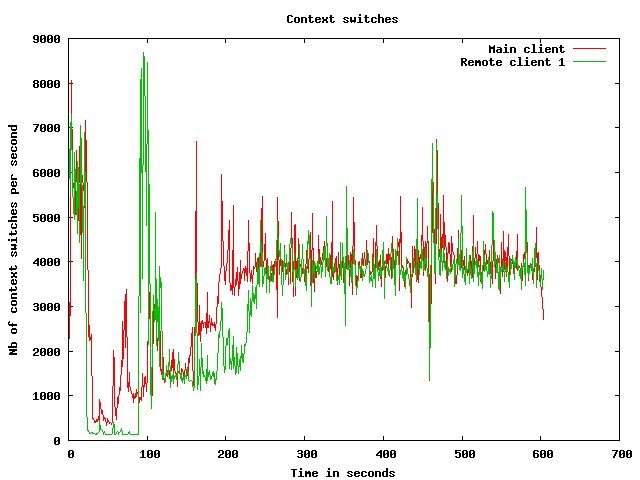
Processes usage graphs
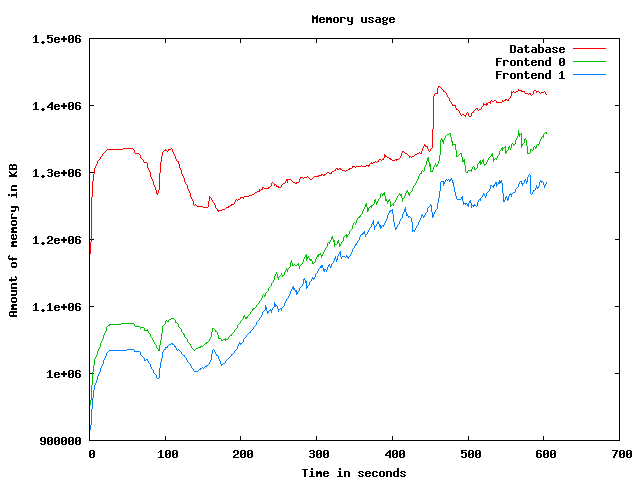
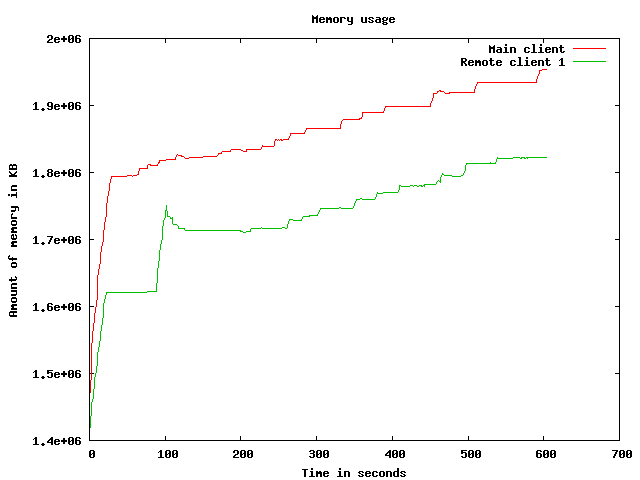
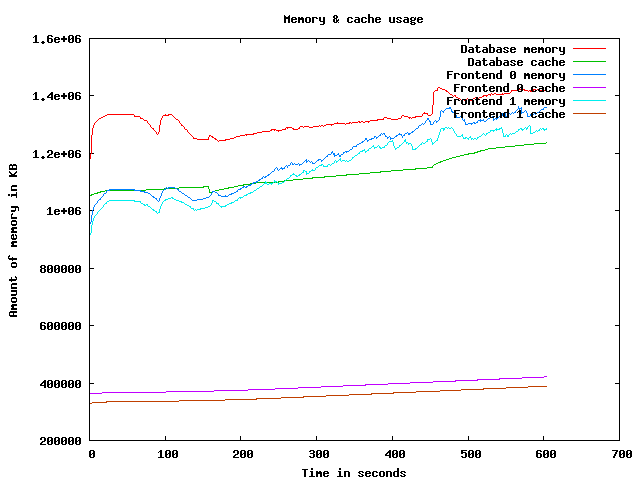
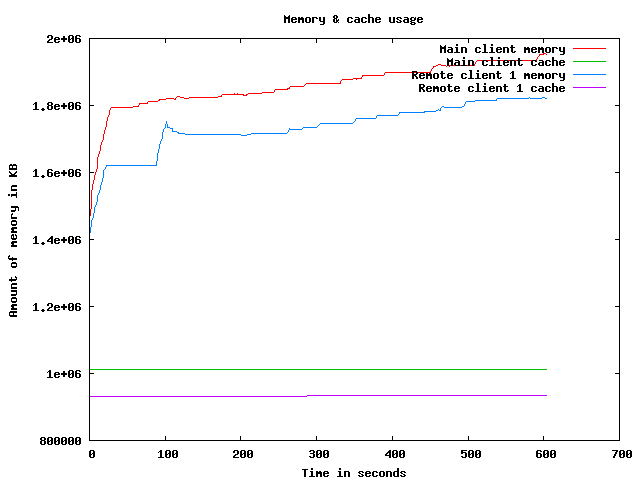
Memory usage graph
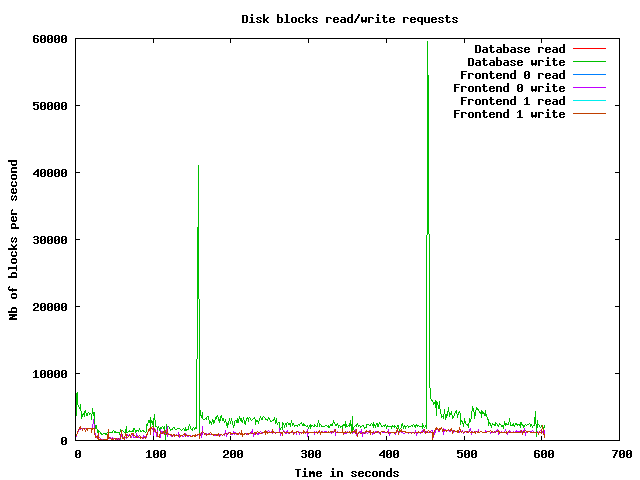
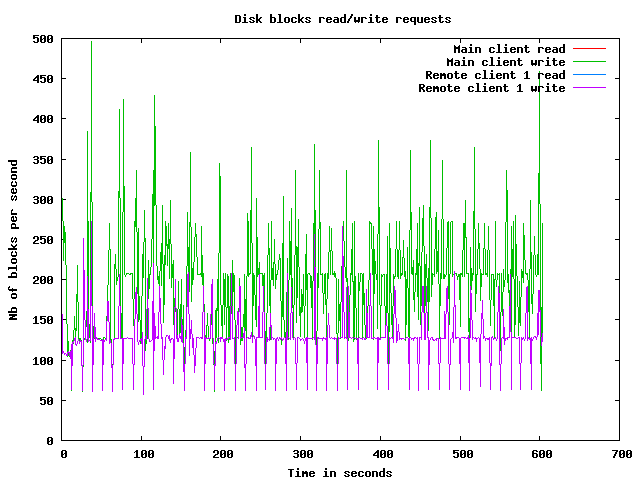
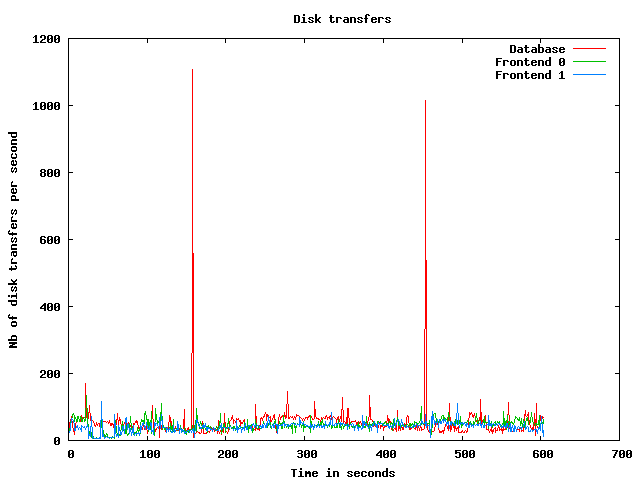
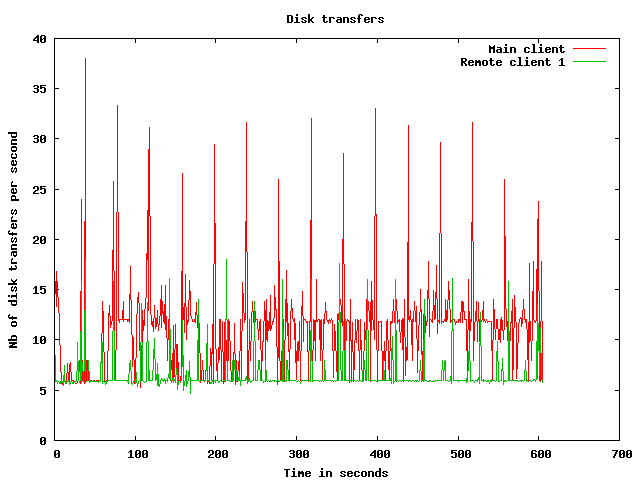
Disk usage graphs
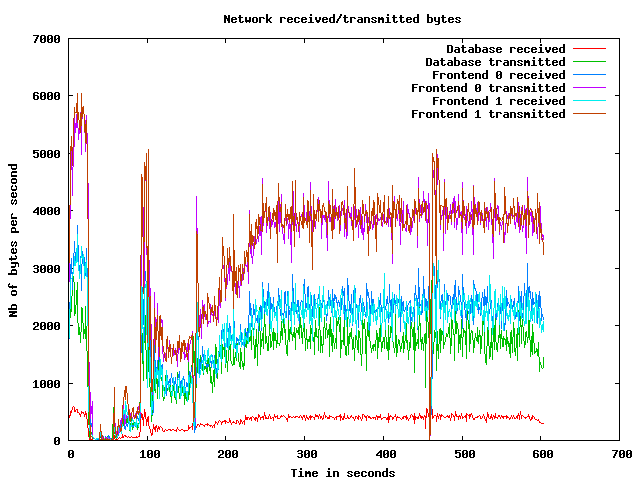
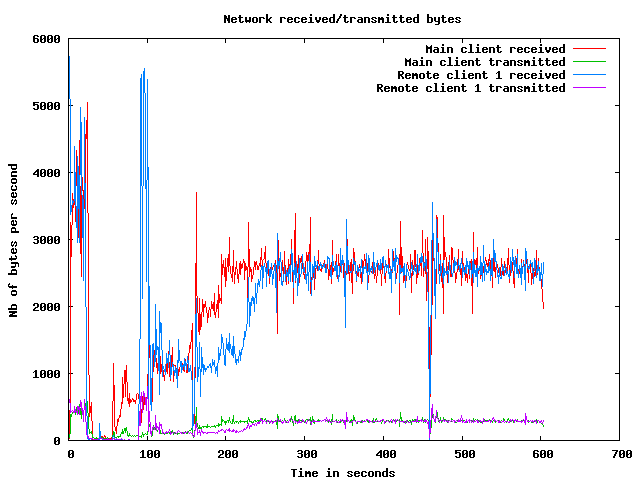
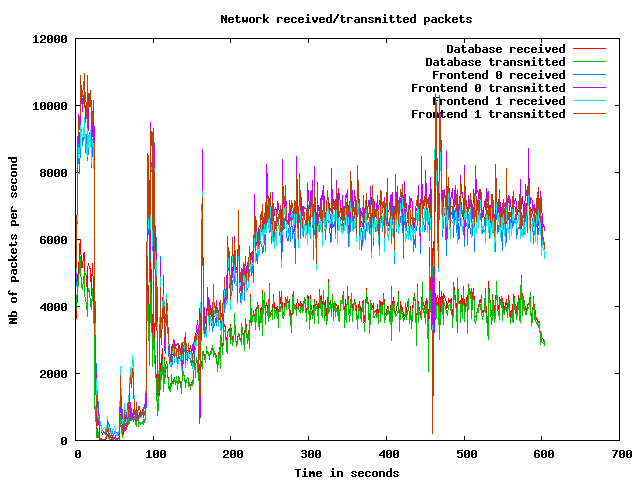
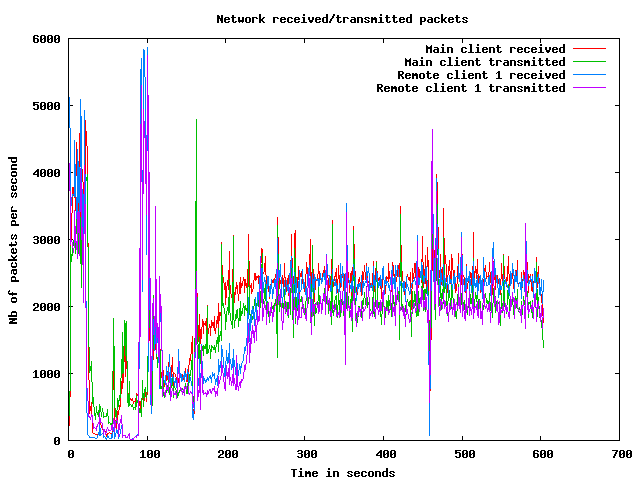
Network usage graphs
| Test start | 2009-3-20 3:54:22 |
| Up ramp start | 2009-3-20 3:54:54 |
| Runtime session start | 2009-3-20 3:56:54 |
| Down ramp start | 2009-3-20 4:4:24 |
| Test end | 2009-3-20 4:6:55 |
| Up ramp length | 2 minutes 1 millisecond (requested 120000 ms) |
| Runtime session length | 7 minutes 30 seconds 0 millisecond (requested 450000 ms) |
| Down ramp length | 30 seconds 0 millisecond (requested 30000 ms) |
| Total test length | 12 minutes 32 seconds 167 milliseconds |
| State name | % of total | Count | Errors | Minimum Time | Maximum Time | Average Time |
|---|---|---|---|---|---|---|
Home | 11 % | 6190 | 0 | 0 ms | 141939 ms | 11844 ms
|
Register | 1 % | 734 | 0 | 0 ms | 99819 ms | 6111 ms
|
RegisterUser | 1 % | 655 | 9 | 5 ms | 129948 ms | 4240 ms
|
Browse | 10 % | 5587 | 0 | 0 ms | 97369 ms | 5667 ms
|
BrowseCategories | 6 % | 3650 | 0 | 3 ms | 97360 ms | 4409 ms
|
SearchItemsInCategory | 14 % | 7589 | 0 | 1 ms | 106858 ms | 3611 ms
|
BrowseRegions | 2 % | 1513 | 0 | 3 ms | 95526 ms | 4435 ms
|
BrowseCategoriesInRegion | 2 % | 1374 | 0 | 3 ms | 96927 ms | 3881 ms
|
SearchItemsInRegion | 4 % | 2531 | 0 | 0 ms | 120944 ms | 3919 ms
|
ViewItem | 11 % | 6178 | 0 | 3 ms | 98333 ms | 3748 ms
|
ViewUserInfo | 2 % | 1083 | 0 | 3 ms | 123942 ms | 3813 ms
|
ViewBidHistory | 0 % | 503 | 0 | 3 ms | 93749 ms | 4247 ms
|
BuyNowAuth | 0 % | 522 | 0 | 2 ms | 93207 ms | 3325 ms
|
BuyNow | 0 % | 458 | 72 | 4 ms | 94541 ms | 4374 ms
|
StoreBuyBow | 0 % | 325 | 0 | 4 ms | 93029 ms | 3335 ms
|
PutBidAuth | 3 % | 2073 | 0 | 0 ms | 96719 ms | 4378 ms
|
PutBid | 3 % | 1949 | 277 | 3 ms | 95677 ms | 3161 ms
|
StoreBid | 2 % | 1072 | 0 | 4 ms | 97098 ms | 2921 ms
|
PutCommentAuth | 0 % | 0 | 0 | 0 ms | 0 ms | 0 ms
|
PutComment | 0 % | 151 | 9 | 5 ms | 93646 ms | 4499 ms
|
StoreComment | 0 % | 120 | 0 | 4 ms | 96360 ms | 2768 ms
|
Sell | 0 % | 383 | 0 | 0 ms | 93041 ms | 5212 ms
|
SelectCategoryToSellItem | 0 % | 360 | 0 | 3 ms | 99839 ms | 5291 ms
|
SellItemForm | 0 % | 327 | 0 | 2 ms | 95364 ms | 5895 ms
|
RegisterItem | 0 % | 291 | 0 | 4 ms | 93270 ms | 4448 ms
|
AboutMe (auth form) | 2 % | 1221 | 0 | 0 ms | 96928 ms | 5050 ms
|
AboutMe | 3 % | 1590 | 0 | 4 ms | 99866 ms | 4658 ms
|
Back probability | 6 % | 3633 | 0 | 0 ms | 0 ms | 0 ms
|
End of Session | 0 % | 472 | 0 | 0 ms | 0 ms | 0 ms
|
Total | 100 % | 52534 | 367 | - | - | 4764 ms
|
Average throughput | 440 req/s
| |||||
Completed sessions | 422
| |||||
Total time | 17346 seconds
| |||||
Average session time | 41 seconds
| |||||
| State name | % of total | Count | Errors | Minimum Time | Maximum Time | Average Time |
|---|---|---|---|---|---|---|
Home | 4 % | 14319 | 0 | 0 ms | 190504 ms | 3252 ms
|
Register | 1 % | 3447 | 0 | 0 ms | 190392 ms | 1646 ms
|
RegisterUser | 1 % | 3409 | 56 | 5 ms | 190036 ms | 604 ms
|
Browse | 7 % | 23154 | 0 | 0 ms | 190561 ms | 857 ms
|
BrowseCategories | 4 % | 16186 | 0 | 3 ms | 190369 ms | 786 ms
|
SearchItemsInCategory | 15 % | 50766 | 0 | 0 ms | 190577 ms | 460 ms
|
BrowseRegions | 2 % | 6700 | 0 | 3 ms | 190051 ms | 776 ms
|
BrowseCategoriesInRegion | 2 % | 6604 | 0 | 3 ms | 190117 ms | 523 ms
|
SearchItemsInRegion | 5 % | 16506 | 0 | 0 ms | 190593 ms | 528 ms
|
ViewItem | 14 % | 46536 | 0 | 3 ms | 190350 ms | 462 ms
|
ViewUserInfo | 3 % | 10486 | 0 | 3 ms | 190036 ms | 367 ms
|
ViewBidHistory | 1 % | 5630 | 0 | 3 ms | 190080 ms | 315 ms
|
BuyNowAuth | 1 % | 4392 | 0 | 2 ms | 190008 ms | 131 ms
|
BuyNow | 1 % | 4290 | 646 | 4 ms | 190065 ms | 336 ms
|
StoreBuyBow | 1 % | 3569 | 1 | 4 ms | 190012 ms | 267 ms
|
PutBidAuth | 4 % | 16106 | 0 | 0 ms | 190329 ms | 352 ms
|
PutBid | 5 % | 18414 | 2179 | 3 ms | 190231 ms | 349 ms
|
StoreBid | 3 % | 12011 | 4 | 4 ms | 190094 ms | 217 ms
|
PutCommentAuth | 0 % | 0 | 0 | 0 ms | 0 ms | 0 ms
|
PutComment | 0 % | 1561 | 126 | 3 ms | 190246 ms | 171 ms
|
StoreComment | 0 % | 1401 | 1 | 5 ms | 190046 ms | 197 ms
|
Sell | 0 % | 1758 | 0 | 0 ms | 190065 ms | 586 ms
|
SelectCategoryToSellItem | 0 % | 1717 | 0 | 3 ms | 190013 ms | 697 ms
|
SellItemForm | 0 % | 1675 | 0 | 2 ms | 190164 ms | 838 ms
|
RegisterItem | 0 % | 1644 | 0 | 4 ms | 190014 ms | 410 ms
|
AboutMe (auth form) | 1 % | 5447 | 0 | 0 ms | 190028 ms | 749 ms
|
AboutMe | 2 % | 9326 | 0 | 4 ms | 190167 ms | 522 ms
|
Back probability | 10 % | 34179 | 0 | 0 ms | 0 ms | 0 ms
|
End of Session | 1 % | 4710 | 0 | 0 ms | 0 ms | 0 ms
|
Total | 100 % | 325943 | 3013 | - | - | 566 ms
|
Average throughput | 731 req/s
| |||||
Completed sessions | 4688
| |||||
Total time | 1211734 seconds
| |||||
Average session time | 258 seconds
| |||||
| State name | % of total | Count | Errors | Minimum Time | Maximum Time | Average Time |
|---|---|---|---|---|---|---|
Home | 4 % | 443 | 0 | 0 ms | 14 ms | 0 ms
|
Register | 1 % | 124 | 0 | 0 ms | 32 ms | 1 ms
|
RegisterUser | 0 % | 108 | 5 | 5 ms | 100 ms | 14 ms
|
Browse | 7 % | 790 | 0 | 0 ms | 264 ms | 1 ms
|
BrowseCategories | 4 % | 540 | 0 | 3 ms | 50 ms | 8 ms
|
SearchItemsInCategory | 15 % | 1690 | 0 | 3 ms | 273 ms | 10 ms
|
BrowseRegions | 2 % | 226 | 0 | 3 ms | 58 ms | 8 ms
|
BrowseCategoriesInRegion | 2 % | 221 | 0 | 3 ms | 48 ms | 8 ms
|
SearchItemsInRegion | 5 % | 551 | 0 | 0 ms | 197 ms | 19 ms
|
ViewItem | 14 % | 1598 | 0 | 3 ms | 275 ms | 12 ms
|
ViewUserInfo | 3 % | 361 | 0 | 3 ms | 64 ms | 11 ms
|
ViewBidHistory | 1 % | 176 | 0 | 3 ms | 123 ms | 25 ms
|
BuyNowAuth | 1 % | 164 | 0 | 2 ms | 76 ms | 5 ms
|
BuyNow | 1 % | 161 | 17 | 5 ms | 53 ms | 15 ms
|
StoreBuyBow | 1 % | 142 | 0 | 5 ms | 38 ms | 10 ms
|
PutBidAuth | 4 % | 517 | 0 | 0 ms | 101 ms | 5 ms
|
PutBid | 5 % | 596 | 66 | 4 ms | 80 ms | 15 ms
|
StoreBid | 3 % | 427 | 0 | 4 ms | 79 ms | 13 ms
|
PutCommentAuth | 0 % | 0 | 0 | 0 ms | 0 ms | 0 ms
|
PutComment | 0 % | 50 | 2 | 5 ms | 40 ms | 15 ms
|
StoreComment | 0 % | 46 | 0 | 6 ms | 45 ms | 12 ms
|
Sell | 0 % | 59 | 0 | 0 ms | 24 ms | 1 ms
|
SelectCategoryToSellItem | 0 % | 45 | 0 | 3 ms | 55 ms | 15 ms
|
SellItemForm | 0 % | 59 | 0 | 2 ms | 14 ms | 5 ms
|
RegisterItem | 0 % | 67 | 0 | 5 ms | 24 ms | 8 ms
|
AboutMe (auth form) | 1 % | 172 | 0 | 0 ms | 10 ms | 1 ms
|
AboutMe | 2 % | 325 | 0 | 4 ms | 152 ms | 26 ms
|
Back probability | 10 % | 1129 | 0 | 0 ms | 0 ms | 0 ms
|
End of Session | 1 % | 148 | 0 | 0 ms | 0 ms | 0 ms
|
Total | 100 % | 10935 | 90 | - | - | 9 ms
|
Average throughput | 367 req/s
| |||||
Completed sessions | 144
| |||||
Total time | 50030 seconds
| |||||
Average session time | 347 seconds
| |||||
| State name | % of total | Count | Errors | Minimum Time | Maximum Time | Average Time |
|---|---|---|---|---|---|---|
Home | 5 % | 20952 | 0 | 0 ms | 190504 ms | 5721 ms
|
Register | 1 % | 4305 | 0 | 0 ms | 190392 ms | 2360 ms
|
RegisterUser | 1 % | 4172 | 70 | 5 ms | 190036 ms | 1159 ms
|
Browse | 7 % | 29531 | 0 | 0 ms | 190561 ms | 1744 ms
|
BrowseCategories | 5 % | 20376 | 0 | 3 ms | 190369 ms | 1414 ms
|
SearchItemsInCategory | 15 % | 60255 | 0 | 0 ms | 190577 ms | 843 ms
|
BrowseRegions | 2 % | 8439 | 0 | 3 ms | 190051 ms | 1411 ms
|
BrowseCategoriesInRegion | 2 % | 8199 | 0 | 3 ms | 190117 ms | 1072 ms
|
SearchItemsInRegion | 5 % | 19639 | 0 | 0 ms | 190593 ms | 950 ms
|
ViewItem | 13 % | 54429 | 0 | 3 ms | 190350 ms | 821 ms
|
ViewUserInfo | 3 % | 11964 | 0 | 3 ms | 190036 ms | 667 ms
|
ViewBidHistory | 1 % | 6323 | 0 | 3 ms | 190080 ms | 619 ms
|
BuyNowAuth | 1 % | 5079 | 0 | 2 ms | 190008 ms | 456 ms
|
BuyNow | 1 % | 4909 | 735 | 4 ms | 190065 ms | 702 ms
|
StoreBuyBow | 1 % | 4036 | 1 | 4 ms | 190012 ms | 505 ms
|
PutBidAuth | 4 % | 18696 | 0 | 0 ms | 190329 ms | 789 ms
|
PutBid | 5 % | 21014 | 2522 | 3 ms | 190231 ms | 600 ms
|
StoreBid | 3 % | 13510 | 4 | 4 ms | 190094 ms | 425 ms
|
PutCommentAuth | 0 % | 0 | 0 | 0 ms | 0 ms | 0 ms
|
PutComment | 0 % | 1762 | 137 | 3 ms | 190246 ms | 537 ms
|
StoreComment | 0 % | 1567 | 1 | 4 ms | 190046 ms | 388 ms
|
Sell | 0 % | 2200 | 0 | 0 ms | 190065 ms | 1375 ms
|
SelectCategoryToSellItem | 0 % | 2122 | 0 | 3 ms | 190013 ms | 1462 ms
|
SellItemForm | 0 % | 2061 | 0 | 2 ms | 190164 ms | 1616 ms
|
RegisterItem | 0 % | 2002 | 0 | 4 ms | 190014 ms | 983 ms
|
AboutMe (auth form) | 1 % | 6840 | 0 | 0 ms | 190028 ms | 1498 ms
|
AboutMe | 2 % | 11308 | 0 | 4 ms | 190167 ms | 1086 ms
|
Back probability | 9 % | 38942 | 0 | 0 ms | 0 ms | 0 ms
|
End of Session | 1 % | 5330 | 0 | 0 ms | 0 ms | 0 ms
|
Total | 100 % | 389962 | 3470 | - | - | 1114 ms
|
Average throughput | 655 req/s
| |||||
Completed sessions | 5330
| |||||
Total time | 1307145 seconds
| |||||
Average session time | 245 seconds
| |||||
An error occured while waiting for remote processes termination (Skipping waits)
Command is: /usr/bin/scp farm6.csail.mit.edu:/tmp/client1 /home/drkp/sandbox/txcache/src/RUBiS-1.4.3/bench/2009-3-20@3:54:22//client1.bin
Command is: /usr/bin/ssh -x localhost /bin/bash -c 'LANG=en_GB.UTF-8 /usr/bin/sar -n DEV -n SOCK -rubcw 1 605 -f /home/drkp/sandbox/txcache/src/RUBiS-1.4.3/bench/2009-3-20@3:54:22//client1.bin > /home/drkp/sandbox/txcache/src/RUBiS-1.4.3/bench/2009-3-20@3:54:22//client1'
Command is: /usr/bin/scp farm14:/tmp/db_server0 /home/drkp/sandbox/txcache/src/RUBiS-1.4.3/bench/2009-3-20@3:54:22//db_server0.bin
Command is: /usr/bin/ssh -x localhost /bin/bash -c 'LANG=en_GB.UTF-8 /usr/bin/sar -n DEV -n SOCK -rubcw 1 605 -f /home/drkp/sandbox/txcache/src/RUBiS-1.4.3/bench/2009-3-20@3:54:22//db_server0.bin > /home/drkp/sandbox/txcache/src/RUBiS-1.4.3/bench/2009-3-20@3:54:22//db_server0'
Command is: /usr/bin/scp farm12.csail.mit.edu:/tmp/web_server0 /home/drkp/sandbox/txcache/src/RUBiS-1.4.3/bench/2009-3-20@3:54:22//web_server0.bin
Command is: /usr/bin/ssh -x localhost /bin/bash -c 'LANG=en_GB.UTF-8 /usr/bin/sar -n DEV -n SOCK -rubcw 1 605 -f /home/drkp/sandbox/txcache/src/RUBiS-1.4.3/bench/2009-3-20@3:54:22//web_server0.bin > /home/drkp/sandbox/txcache/src/RUBiS-1.4.3/bench/2009-3-20@3:54:22//web_server0'
Command is: /usr/bin/scp farm13.csail.mit.edu:/tmp/web_server1 /home/drkp/sandbox/txcache/src/RUBiS-1.4.3/bench/2009-3-20@3:54:22//web_server1.bin
Command is: /usr/bin/ssh -x localhost /bin/bash -c 'LANG=en_GB.UTF-8 /usr/bin/sar -n DEV -n SOCK -rubcw 1 605 -f /home/drkp/sandbox/txcache/src/RUBiS-1.4.3/bench/2009-3-20@3:54:22//web_server1.bin > /home/drkp/sandbox/txcache/src/RUBiS-1.4.3/bench/2009-3-20@3:54:22//web_server1'
Command is: /usr/bin/scp localhost:/tmp/client0 /home/drkp/sandbox/txcache/src/RUBiS-1.4.3/bench/2009-3-20@3:54:22//client0.bin
Command is: /usr/bin/ssh -x localhost /bin/bash -c 'LANG=en_GB.UTF-8 /usr/bin/sar -n DEV -n SOCK -rubcw 1 605 -f /home/drkp/sandbox/txcache/src/RUBiS-1.4.3/bench/2009-3-20@3:54:22//client0.bin > /home/drkp/sandbox/txcache/src/RUBiS-1.4.3/bench/2009-3-20@3:54:22//client0'
Command is: /usr/bin/scp farm6.csail.mit.edu:/tmp/trace_client1.html /home/drkp/sandbox/txcache/src/RUBiS-1.4.3/bench/2009-3-20@3:54:22//
Command is: /usr/bin/scp farm6.csail.mit.edu:/tmp/stat_client1.html /home/drkp/sandbox/txcache/src/RUBiS-1.4.3/bench/2009-3-20@3:54:22//
|
|
|
|
|
|
 | 
|
 | 
|
 | 
|
 | 
|
 | 
|
 | 
|
 | 
|
 | 
|
 | 
|