Node information
Test timing information
Up ramp statistics
Runtime session statistics
Down ramp statistics
Overall statistics
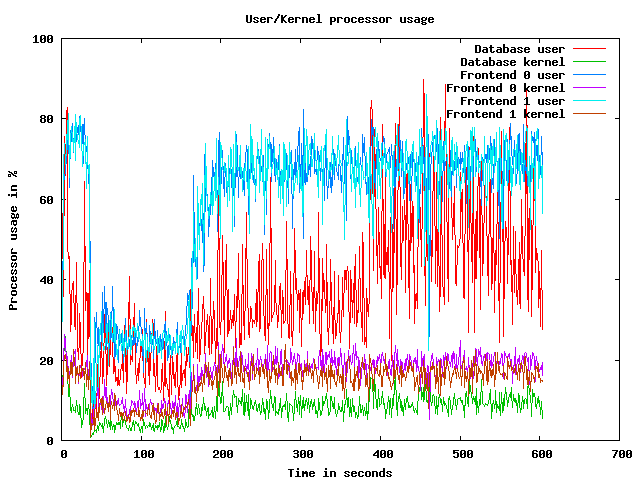
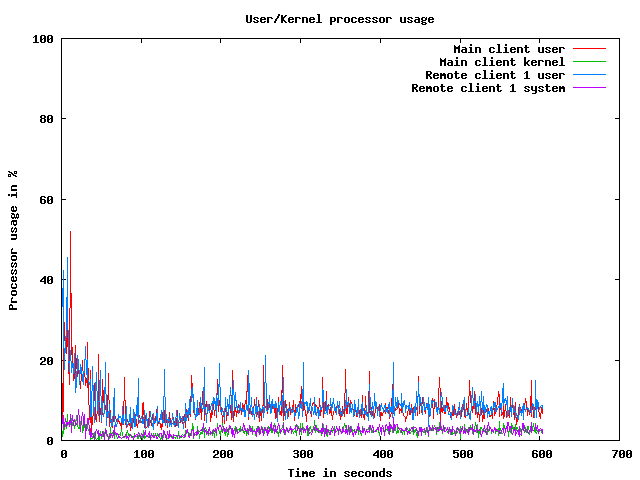
CPU usage graphs
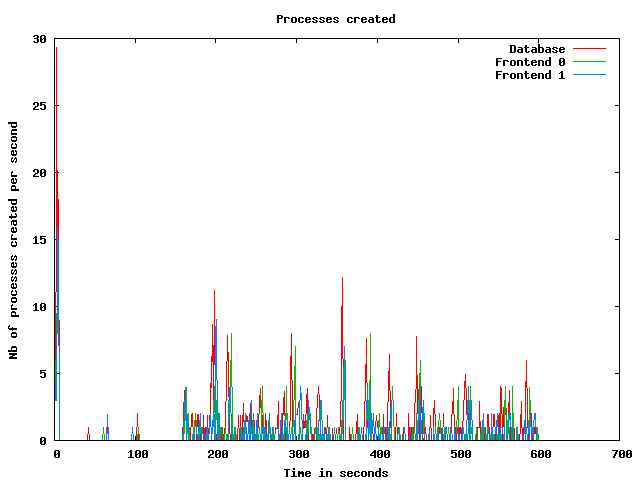
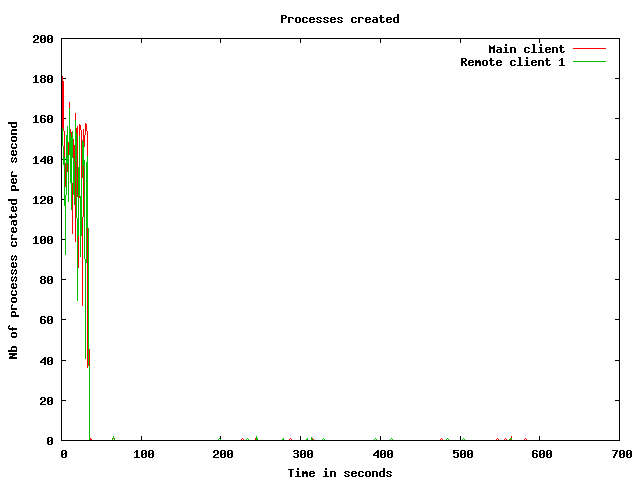
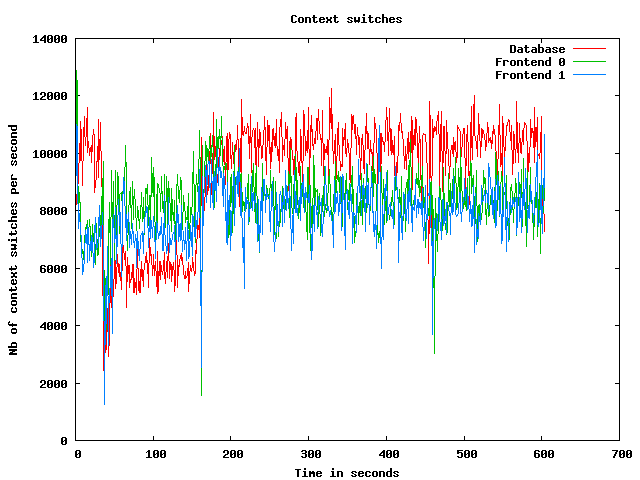
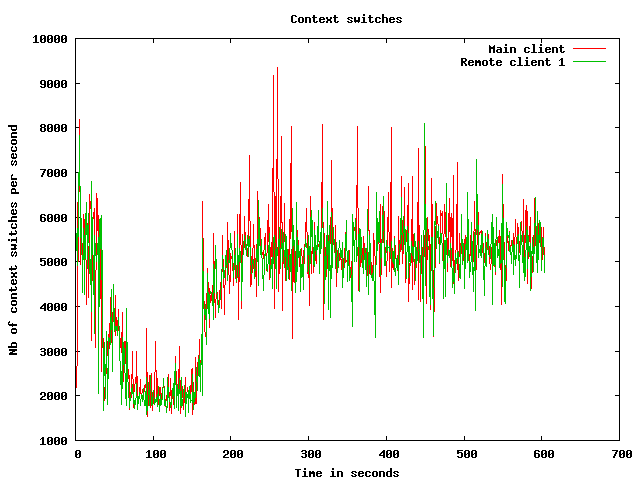
Processes usage graphs
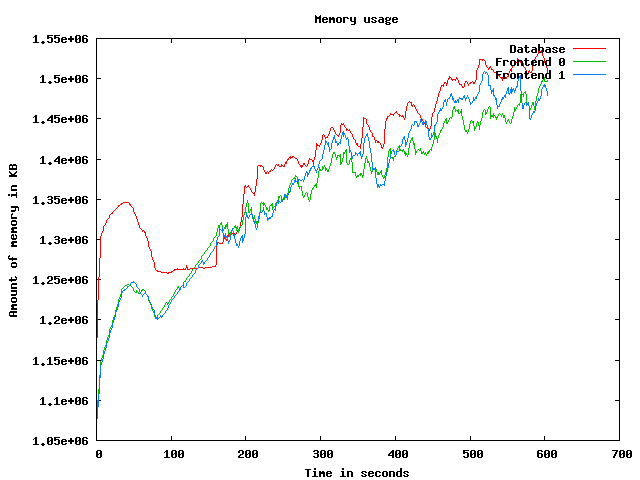
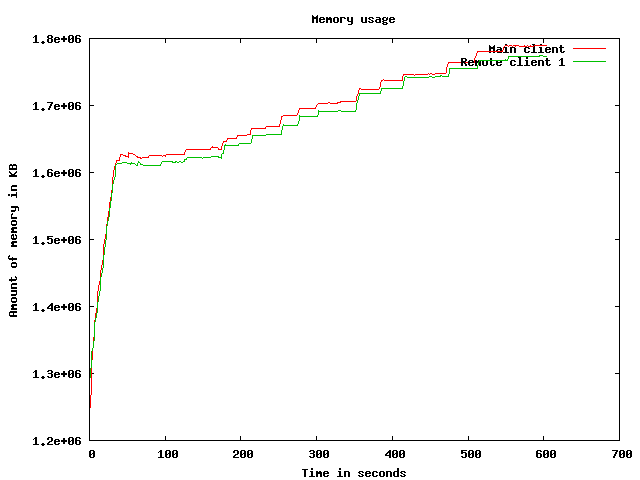
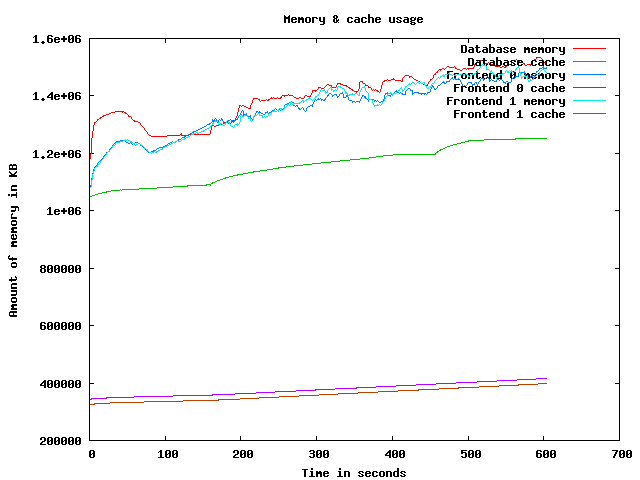
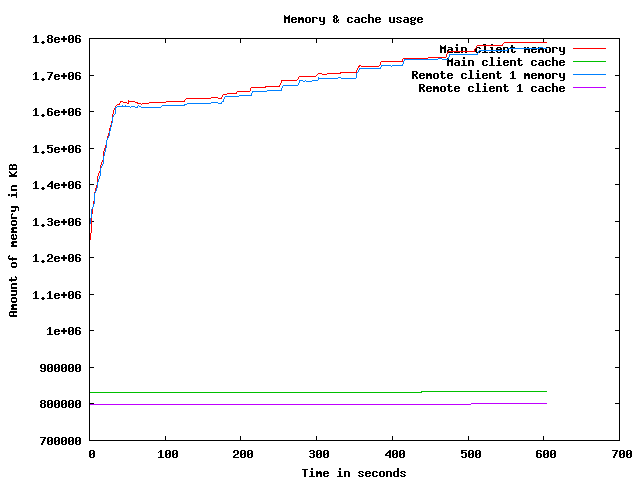
Memory usage graph
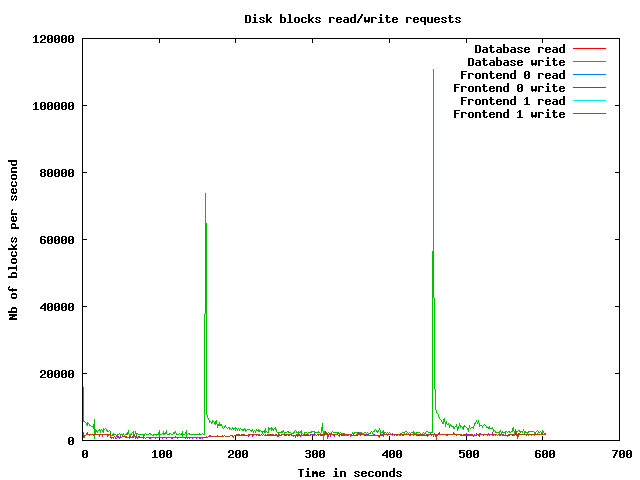
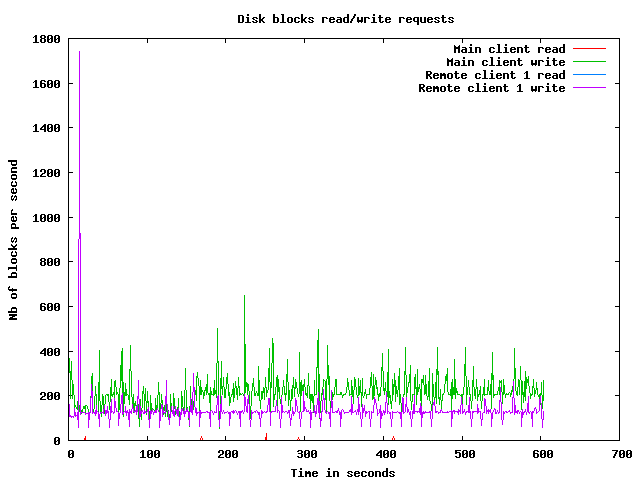
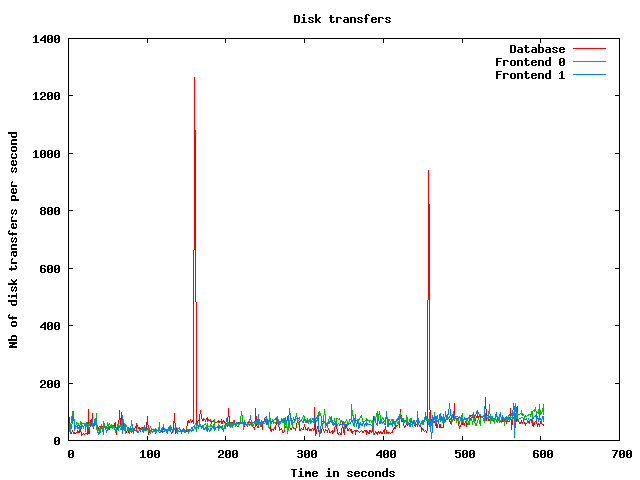
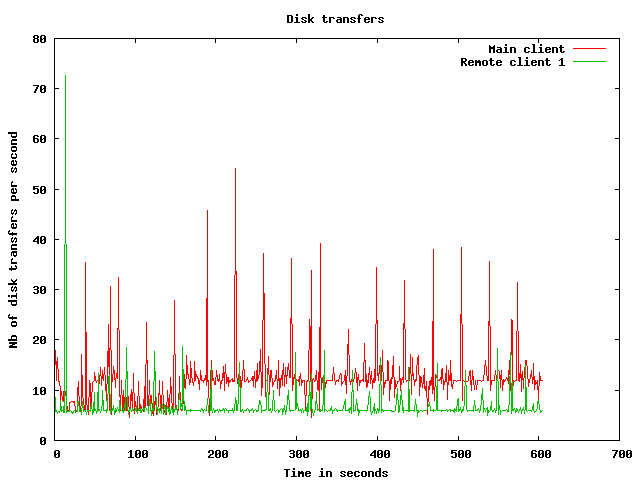
Disk usage graphs
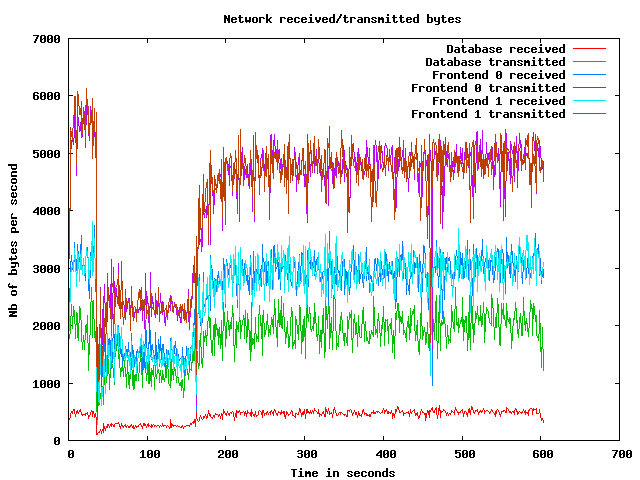
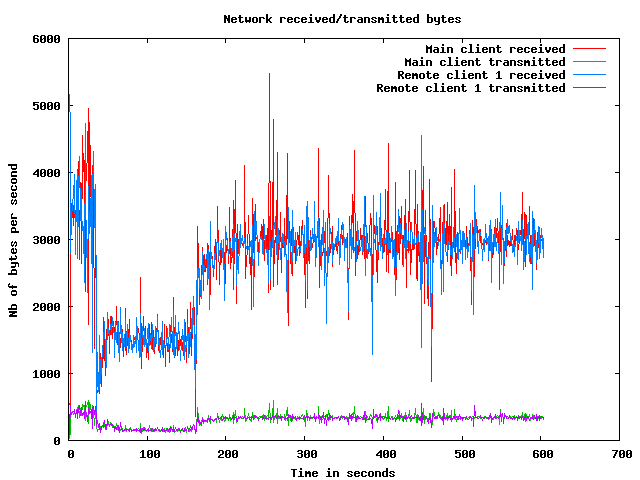
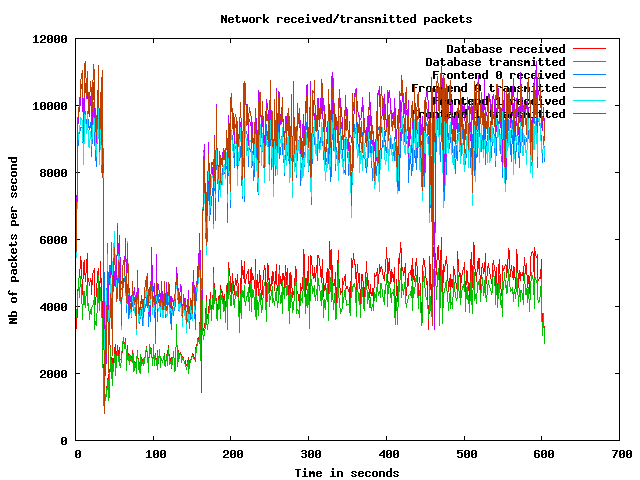
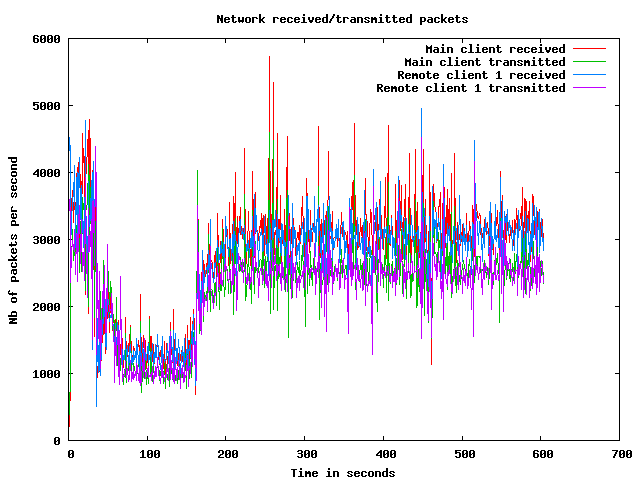
Network usage graphs
| Test start | 2009-3-20 5:44:41 |
| Up ramp start | 2009-3-20 5:45:17 |
| Runtime session start | 2009-3-20 5:47:17 |
| Down ramp start | 2009-3-20 5:54:47 |
| Test end | 2009-3-20 5:57:24 |
| Up ramp length | 2 minutes 1 millisecond (requested 120000 ms) |
| Runtime session length | 7 minutes 30 seconds 0 millisecond (requested 450000 ms) |
| Down ramp length | 30 seconds 0 millisecond (requested 30000 ms) |
| Total test length | 12 minutes 43 seconds 330 milliseconds |
| State name | % of total | Count | Errors | Minimum Time | Maximum Time | Average Time |
|---|---|---|---|---|---|---|
Home | 9 % | 8153 | 0 | 0 ms | 93003 ms | 4814 ms
|
Register | 1 % | 1099 | 0 | 0 ms | 59126 ms | 2036 ms
|
RegisterUser | 1 % | 1027 | 16 | 5 ms | 45514 ms | 1659 ms
|
Browse | 9 % | 8416 | 0 | 0 ms | 93000 ms | 2314 ms
|
BrowseCategories | 6 % | 5483 | 0 | 3 ms | 59103 ms | 1661 ms
|
SearchItemsInCategory | 14 % | 12943 | 0 | 3 ms | 65106 ms | 1503 ms
|
BrowseRegions | 2 % | 2410 | 0 | 3 ms | 65099 ms | 1805 ms
|
BrowseCategoriesInRegion | 2 % | 2268 | 0 | 3 ms | 59096 ms | 1751 ms
|
SearchItemsInRegion | 5 % | 4636 | 0 | 0 ms | 45475 ms | 1531 ms
|
ViewItem | 12 % | 11271 | 0 | 3 ms | 56107 ms | 1326 ms
|
ViewUserInfo | 2 % | 2075 | 0 | 3 ms | 45349 ms | 1246 ms
|
ViewBidHistory | 1 % | 1047 | 0 | 3 ms | 45085 ms | 792 ms
|
BuyNowAuth | 1 % | 936 | 0 | 2 ms | 45058 ms | 945 ms
|
BuyNow | 0 % | 853 | 123 | 3 ms | 45095 ms | 995 ms
|
StoreBuyBow | 0 % | 651 | 0 | 4 ms | 45094 ms | 1064 ms
|
PutBidAuth | 4 % | 3765 | 0 | 0 ms | 59118 ms | 1257 ms
|
PutBid | 4 % | 3784 | 488 | 1 ms | 59105 ms | 1240 ms
|
StoreBid | 2 % | 2224 | 0 | 4 ms | 56109 ms | 1127 ms
|
PutCommentAuth | 0 % | 0 | 0 | 0 ms | 0 ms | 0 ms
|
PutComment | 0 % | 330 | 34 | 4 ms | 45015 ms | 1063 ms
|
StoreComment | 0 % | 274 | 0 | 4 ms | 45042 ms | 707 ms
|
Sell | 0 % | 648 | 0 | 0 ms | 45520 ms | 2032 ms
|
SelectCategoryToSellItem | 0 % | 604 | 0 | 3 ms | 45518 ms | 1930 ms
|
SellItemForm | 0 % | 565 | 0 | 2 ms | 45531 ms | 1835 ms
|
RegisterItem | 0 % | 532 | 0 | 4 ms | 45074 ms | 1544 ms
|
AboutMe (auth form) | 2 % | 1860 | 0 | 0 ms | 45510 ms | 2172 ms
|
AboutMe | 3 % | 2691 | 0 | 4 ms | 93063 ms | 1528 ms
|
Back probability | 8 % | 7137 | 0 | 0 ms | 0 ms | 0 ms
|
End of Session | 1 % | 943 | 0 | 0 ms | 0 ms | 0 ms
|
Total | 100 % | 88625 | 661 | - | - | 1707 ms
|
Average throughput | 744 req/s
| |||||
Completed sessions | 870
| |||||
Total time | 48712 seconds
| |||||
Average session time | 55 seconds
| |||||
| State name | % of total | Count | Errors | Minimum Time | Maximum Time | Average Time |
|---|---|---|---|---|---|---|
Home | 4 % | 15762 | 0 | 0 ms | 9896 ms | 20 ms
|
Register | 1 % | 3739 | 0 | 0 ms | 9225 ms | 36 ms
|
RegisterUser | 1 % | 3693 | 59 | 5 ms | 9644 ms | 86 ms
|
Browse | 7 % | 25931 | 0 | 0 ms | 21103 ms | 40 ms
|
BrowseCategories | 4 % | 18168 | 0 | 3 ms | 9465 ms | 64 ms
|
SearchItemsInCategory | 15 % | 57315 | 0 | 2 ms | 21170 ms | 67 ms
|
BrowseRegions | 2 % | 7459 | 0 | 3 ms | 9481 ms | 64 ms
|
BrowseCategoriesInRegion | 1 % | 7339 | 0 | 3 ms | 9590 ms | 75 ms
|
SearchItemsInRegion | 5 % | 18716 | 0 | 0 ms | 9678 ms | 82 ms
|
ViewItem | 14 % | 52388 | 0 | 3 ms | 21175 ms | 77 ms
|
ViewUserInfo | 3 % | 12067 | 0 | 3 ms | 9435 ms | 70 ms
|
ViewBidHistory | 1 % | 6437 | 0 | 3 ms | 9270 ms | 191 ms
|
BuyNowAuth | 1 % | 4887 | 0 | 2 ms | 9071 ms | 41 ms
|
BuyNow | 1 % | 4819 | 665 | 4 ms | 21147 ms | 99 ms
|
StoreBuyBow | 1 % | 4072 | 4 | 4 ms | 9281 ms | 77 ms
|
PutBidAuth | 4 % | 18171 | 0 | 0 ms | 21125 ms | 43 ms
|
PutBid | 5 % | 20933 | 2398 | 4 ms | 9613 ms | 87 ms
|
StoreBid | 3 % | 13708 | 18 | 4 ms | 9443 ms | 74 ms
|
PutCommentAuth | 0 % | 0 | 0 | 0 ms | 0 ms | 0 ms
|
PutComment | 0 % | 1808 | 141 | 4 ms | 3879 ms | 80 ms
|
StoreComment | 0 % | 1634 | 0 | 5 ms | 9332 ms | 71 ms
|
Sell | 0 % | 2084 | 0 | 0 ms | 9343 ms | 41 ms
|
SelectCategoryToSellItem | 0 % | 2056 | 0 | 3 ms | 9250 ms | 72 ms
|
SellItemForm | 0 % | 2026 | 0 | 2 ms | 9138 ms | 41 ms
|
RegisterItem | 0 % | 1988 | 0 | 4 ms | 9588 ms | 87 ms
|
AboutMe (auth form) | 1 % | 6012 | 0 | 0 ms | 9340 ms | 30 ms
|
AboutMe | 2 % | 10371 | 0 | 4 ms | 9770 ms | 154 ms
|
Back probability | 10 % | 39078 | 0 | 0 ms | 0 ms | 0 ms
|
End of Session | 1 % | 5326 | 0 | 0 ms | 0 ms | 0 ms
|
Total | 100 % | 367987 | 3285 | - | - | 61 ms
|
Average throughput | 825 req/s
| |||||
Completed sessions | 5300
| |||||
Total time | 1345619 seconds
| |||||
Average session time | 253 seconds
| |||||
| State name | % of total | Count | Errors | Minimum Time | Maximum Time | Average Time |
|---|---|---|---|---|---|---|
Home | 4 % | 515 | 0 | 0 ms | 59 ms | 0 ms
|
Register | 1 % | 131 | 0 | 0 ms | 32 ms | 1 ms
|
RegisterUser | 0 % | 114 | 5 | 5 ms | 45 ms | 12 ms
|
Browse | 6 % | 848 | 0 | 0 ms | 43 ms | 1 ms
|
BrowseCategories | 4 % | 586 | 0 | 3 ms | 90 ms | 9 ms
|
SearchItemsInCategory | 15 % | 1950 | 0 | 3 ms | 310 ms | 11 ms
|
BrowseRegions | 2 % | 267 | 0 | 3 ms | 59 ms | 9 ms
|
BrowseCategoriesInRegion | 2 % | 273 | 0 | 3 ms | 74 ms | 8 ms
|
SearchItemsInRegion | 5 % | 651 | 0 | 0 ms | 203 ms | 20 ms
|
ViewItem | 13 % | 1681 | 0 | 3 ms | 197 ms | 14 ms
|
ViewUserInfo | 2 % | 364 | 0 | 3 ms | 91 ms | 14 ms
|
ViewBidHistory | 1 % | 231 | 0 | 3 ms | 718 ms | 57 ms
|
BuyNowAuth | 1 % | 143 | 0 | 2 ms | 26 ms | 4 ms
|
BuyNow | 1 % | 137 | 18 | 3 ms | 90 ms | 20 ms
|
StoreBuyBow | 1 % | 149 | 0 | 4 ms | 100 ms | 12 ms
|
PutBidAuth | 5 % | 616 | 0 | 0 ms | 47 ms | 4 ms
|
PutBid | 5 % | 684 | 76 | 3 ms | 106 ms | 16 ms
|
StoreBid | 3 % | 444 | 0 | 5 ms | 51 ms | 13 ms
|
PutCommentAuth | 0 % | 0 | 0 | 0 ms | 0 ms | 0 ms
|
PutComment | 0 % | 50 | 3 | 4 ms | 85 ms | 18 ms
|
StoreComment | 0 % | 50 | 0 | 4 ms | 51 ms | 12 ms
|
Sell | 0 % | 76 | 0 | 0 ms | 48 ms | 2 ms
|
SelectCategoryToSellItem | 0 % | 71 | 0 | 3 ms | 73 ms | 12 ms
|
SellItemForm | 0 % | 75 | 0 | 2 ms | 18 ms | 4 ms
|
RegisterItem | 0 % | 72 | 0 | 4 ms | 98 ms | 10 ms
|
AboutMe (auth form) | 1 % | 186 | 0 | 0 ms | 37 ms | 1 ms
|
AboutMe | 2 % | 346 | 0 | 4 ms | 315 ms | 42 ms
|
Back probability | 10 % | 1320 | 0 | 0 ms | 0 ms | 0 ms
|
End of Session | 1 % | 169 | 0 | 0 ms | 0 ms | 0 ms
|
Total | 100 % | 12199 | 102 | - | - | 11 ms
|
Average throughput | 410 req/s
| |||||
Completed sessions | 188
| |||||
Total time | 60780 seconds
| |||||
Average session time | 323 seconds
| |||||
| State name | % of total | Count | Errors | Minimum Time | Maximum Time | Average Time |
|---|---|---|---|---|---|---|
Home | 5 % | 24430 | 0 | 0 ms | 93003 ms | 1619 ms
|
Register | 1 % | 4969 | 0 | 0 ms | 59126 ms | 477 ms
|
RegisterUser | 1 % | 4834 | 80 | 5 ms | 45514 ms | 418 ms
|
Browse | 7 % | 35195 | 0 | 0 ms | 93000 ms | 583 ms
|
BrowseCategories | 5 % | 24237 | 0 | 3 ms | 59103 ms | 424 ms
|
SearchItemsInCategory | 15 % | 72465 | 0 | 2 ms | 65106 ms | 322 ms
|
BrowseRegions | 2 % | 10136 | 0 | 3 ms | 65099 ms | 477 ms
|
BrowseCategoriesInRegion | 2 % | 9880 | 0 | 3 ms | 59096 ms | 458 ms
|
SearchItemsInRegion | 5 % | 24065 | 0 | 0 ms | 45475 ms | 360 ms
|
ViewItem | 13 % | 65455 | 0 | 3 ms | 56107 ms | 291 ms
|
ViewUserInfo | 3 % | 14541 | 0 | 3 ms | 45349 ms | 236 ms
|
ViewBidHistory | 1 % | 7739 | 0 | 3 ms | 45085 ms | 268 ms
|
BuyNowAuth | 1 % | 5966 | 0 | 2 ms | 45058 ms | 182 ms
|
BuyNow | 1 % | 5809 | 806 | 3 ms | 45095 ms | 229 ms
|
StoreBuyBow | 1 % | 4872 | 4 | 4 ms | 45094 ms | 207 ms
|
PutBidAuth | 4 % | 22552 | 0 | 0 ms | 59118 ms | 245 ms
|
PutBid | 5 % | 25465 | 2962 | 1 ms | 59105 ms | 256 ms
|
StoreBid | 3 % | 16376 | 18 | 4 ms | 56109 ms | 215 ms
|
PutCommentAuth | 0 % | 0 | 0 | 0 ms | 0 ms | 0 ms
|
PutComment | 0 % | 2188 | 178 | 4 ms | 45015 ms | 227 ms
|
StoreComment | 0 % | 1958 | 0 | 4 ms | 45042 ms | 158 ms
|
Sell | 0 % | 2808 | 0 | 0 ms | 45520 ms | 499 ms
|
SelectCategoryToSellItem | 0 % | 2731 | 0 | 3 ms | 45518 ms | 481 ms
|
SellItemForm | 0 % | 2666 | 0 | 2 ms | 45531 ms | 420 ms
|
RegisterItem | 0 % | 2592 | 0 | 4 ms | 45074 ms | 384 ms
|
AboutMe (auth form) | 1 % | 8058 | 0 | 0 ms | 45510 ms | 524 ms
|
AboutMe | 2 % | 13475 | 0 | 4 ms | 93063 ms | 425 ms
|
Back probability | 10 % | 47535 | 0 | 0 ms | 0 ms | 0 ms
|
End of Session | 1 % | 6439 | 0 | 0 ms | 0 ms | 0 ms
|
Total | 100 % | 469436 | 4048 | - | - | 370 ms
|
Average throughput | 789 req/s
| |||||
Completed sessions | 6439
| |||||
Total time | 1484759 seconds
| |||||
Average session time | 230 seconds
| |||||
An error occured while waiting for remote processes termination (Skipping waits)
Command is: /usr/bin/scp farm6.csail.mit.edu:/tmp/client1 /home/drkp/sandbox/txcache/src/RUBiS-1.4.3/bench/2009-3-20@5:44:41//client1.bin
Command is: /usr/bin/ssh -x localhost /bin/bash -c 'LANG=en_GB.UTF-8 /usr/bin/sar -n DEV -n SOCK -rubcw 1 605 -f /home/drkp/sandbox/txcache/src/RUBiS-1.4.3/bench/2009-3-20@5:44:41//client1.bin > /home/drkp/sandbox/txcache/src/RUBiS-1.4.3/bench/2009-3-20@5:44:41//client1'
Command is: /usr/bin/scp farm14:/tmp/db_server0 /home/drkp/sandbox/txcache/src/RUBiS-1.4.3/bench/2009-3-20@5:44:41//db_server0.bin
Command is: /usr/bin/ssh -x localhost /bin/bash -c 'LANG=en_GB.UTF-8 /usr/bin/sar -n DEV -n SOCK -rubcw 1 605 -f /home/drkp/sandbox/txcache/src/RUBiS-1.4.3/bench/2009-3-20@5:44:41//db_server0.bin > /home/drkp/sandbox/txcache/src/RUBiS-1.4.3/bench/2009-3-20@5:44:41//db_server0'
Command is: /usr/bin/scp farm12.csail.mit.edu:/tmp/web_server0 /home/drkp/sandbox/txcache/src/RUBiS-1.4.3/bench/2009-3-20@5:44:41//web_server0.bin
Command is: /usr/bin/ssh -x localhost /bin/bash -c 'LANG=en_GB.UTF-8 /usr/bin/sar -n DEV -n SOCK -rubcw 1 605 -f /home/drkp/sandbox/txcache/src/RUBiS-1.4.3/bench/2009-3-20@5:44:41//web_server0.bin > /home/drkp/sandbox/txcache/src/RUBiS-1.4.3/bench/2009-3-20@5:44:41//web_server0'
Command is: /usr/bin/scp farm13.csail.mit.edu:/tmp/web_server1 /home/drkp/sandbox/txcache/src/RUBiS-1.4.3/bench/2009-3-20@5:44:41//web_server1.bin
Command is: /usr/bin/ssh -x localhost /bin/bash -c 'LANG=en_GB.UTF-8 /usr/bin/sar -n DEV -n SOCK -rubcw 1 605 -f /home/drkp/sandbox/txcache/src/RUBiS-1.4.3/bench/2009-3-20@5:44:41//web_server1.bin > /home/drkp/sandbox/txcache/src/RUBiS-1.4.3/bench/2009-3-20@5:44:41//web_server1'
Command is: /usr/bin/scp localhost:/tmp/client0 /home/drkp/sandbox/txcache/src/RUBiS-1.4.3/bench/2009-3-20@5:44:41//client0.bin
Command is: /usr/bin/ssh -x localhost /bin/bash -c 'LANG=en_GB.UTF-8 /usr/bin/sar -n DEV -n SOCK -rubcw 1 605 -f /home/drkp/sandbox/txcache/src/RUBiS-1.4.3/bench/2009-3-20@5:44:41//client0.bin > /home/drkp/sandbox/txcache/src/RUBiS-1.4.3/bench/2009-3-20@5:44:41//client0'
Command is: /usr/bin/scp farm6.csail.mit.edu:/tmp/trace_client1.html /home/drkp/sandbox/txcache/src/RUBiS-1.4.3/bench/2009-3-20@5:44:41//
Command is: /usr/bin/scp farm6.csail.mit.edu:/tmp/stat_client1.html /home/drkp/sandbox/txcache/src/RUBiS-1.4.3/bench/2009-3-20@5:44:41//
|
|
|
|
|
|
 | 
|
 | 
|
 | 
|
 | 
|
 | 
|
 | 
|
 | 
|
 | 
|
 | 
|