Node information
Test timing information
Up ramp statistics
Runtime session statistics
Down ramp statistics
Overall statistics
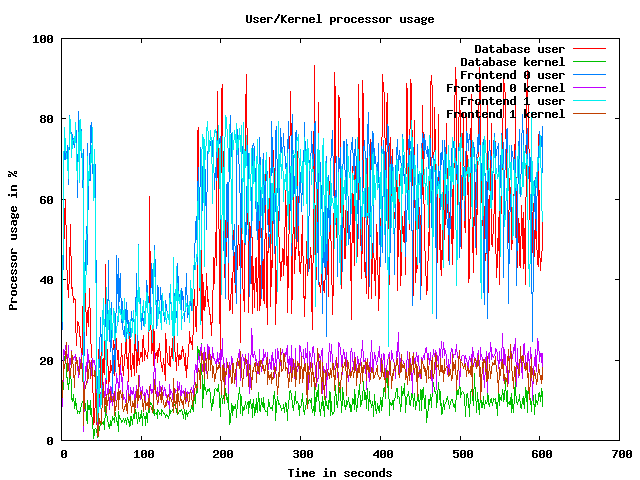
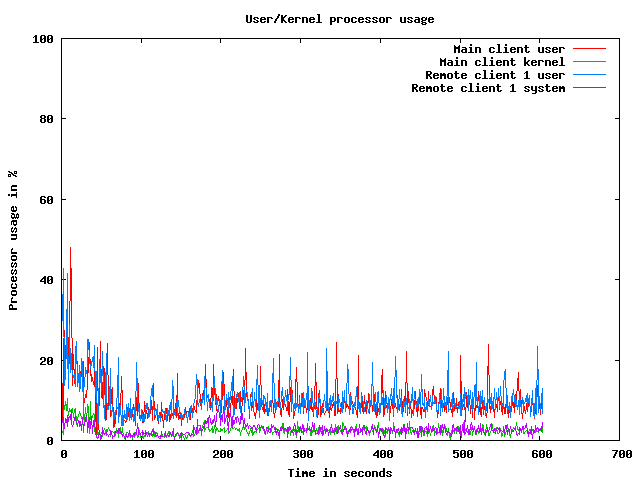
CPU usage graphs
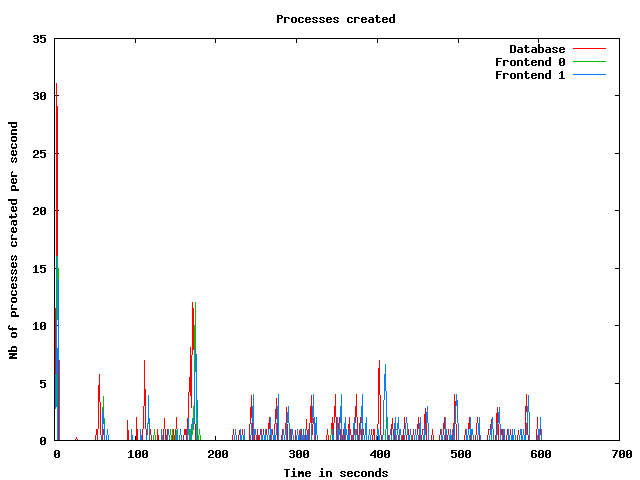
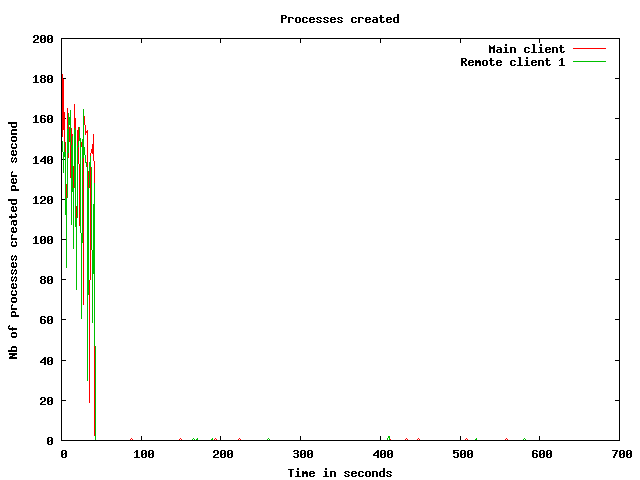
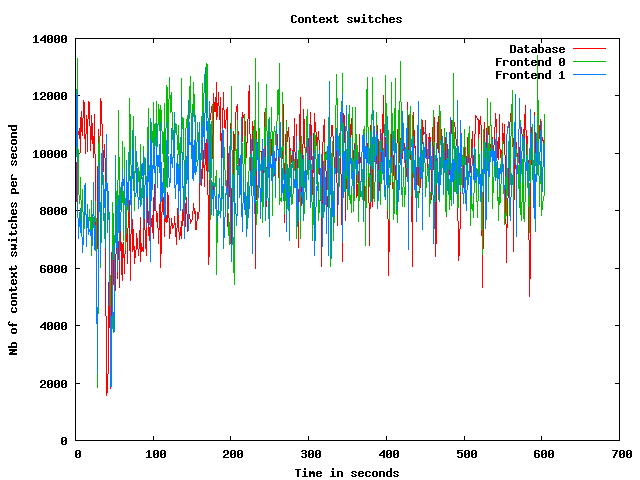
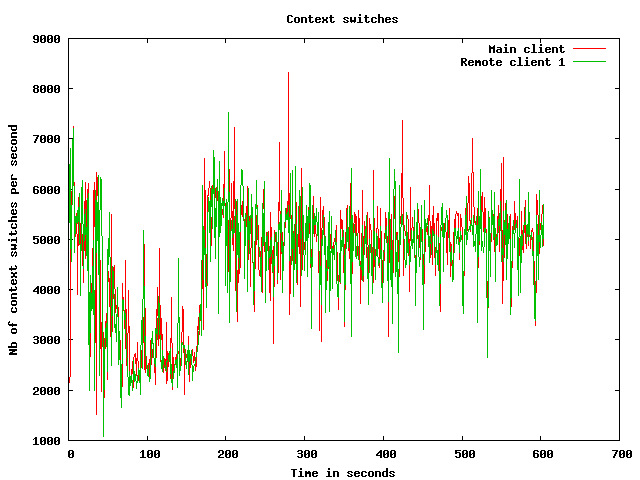
Processes usage graphs
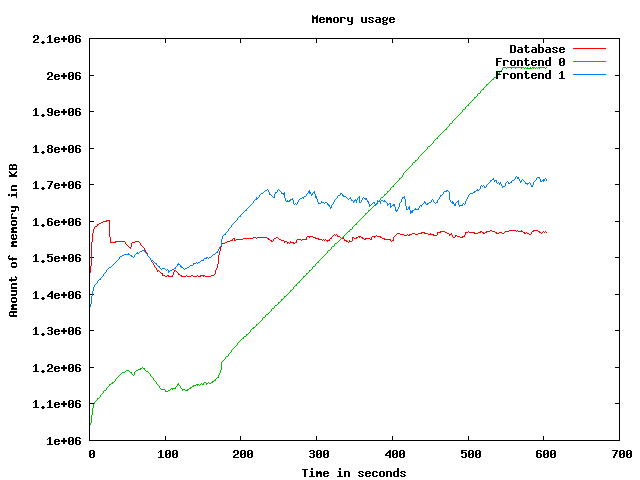
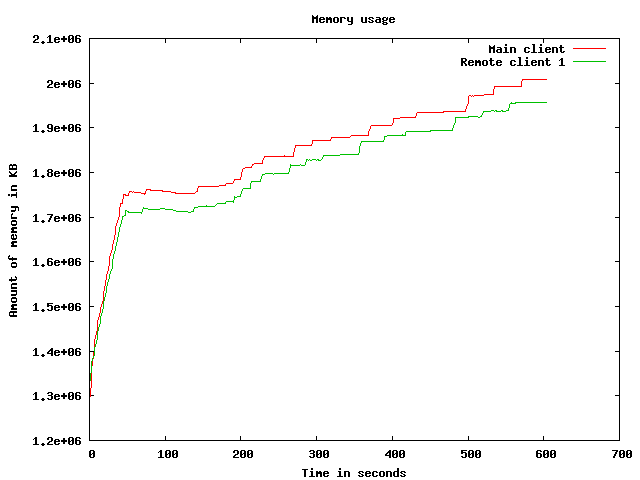
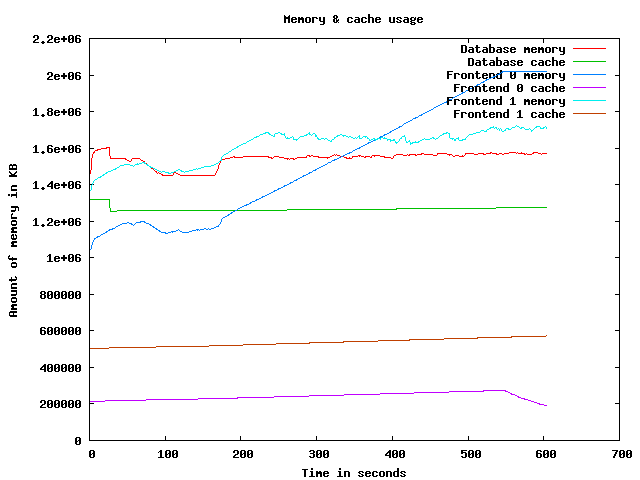
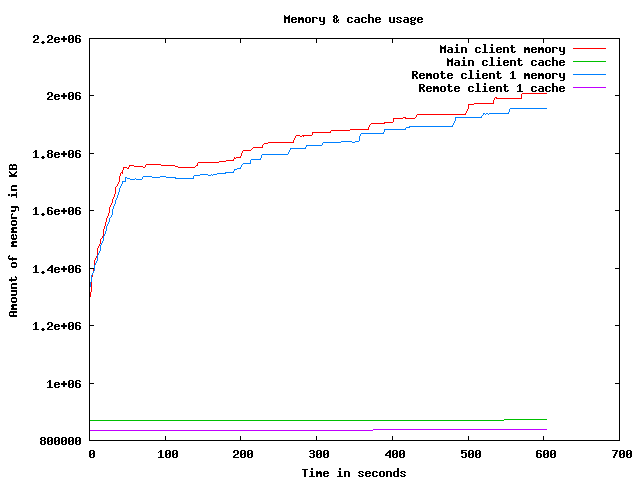
Memory usage graph
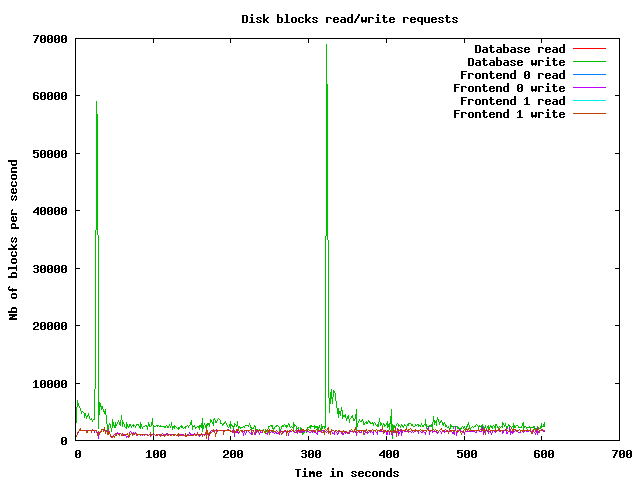
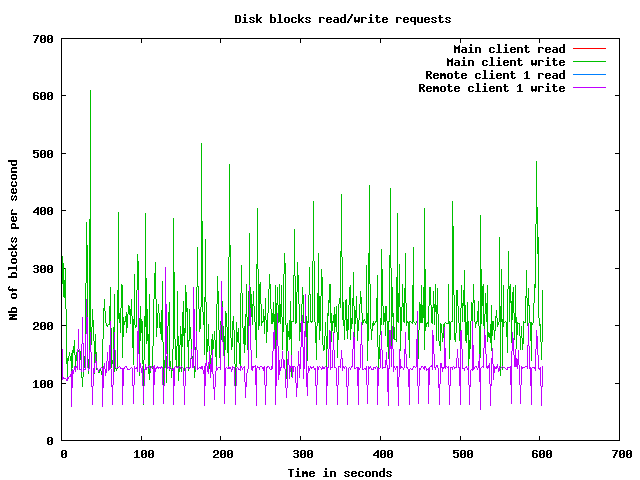
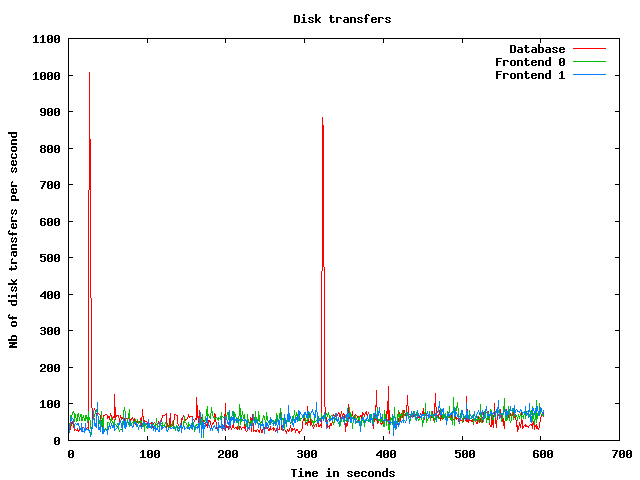
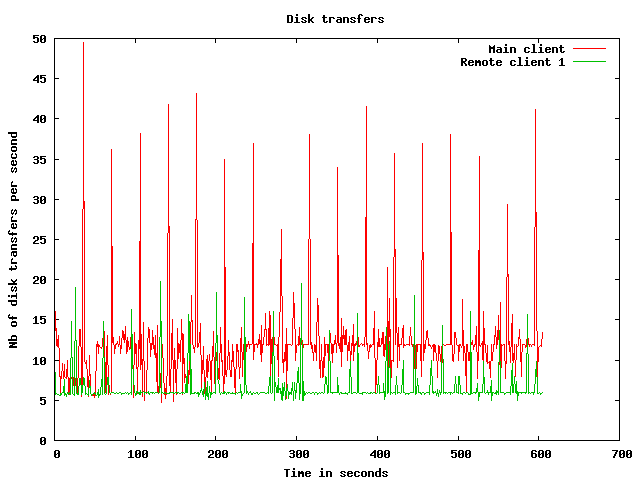
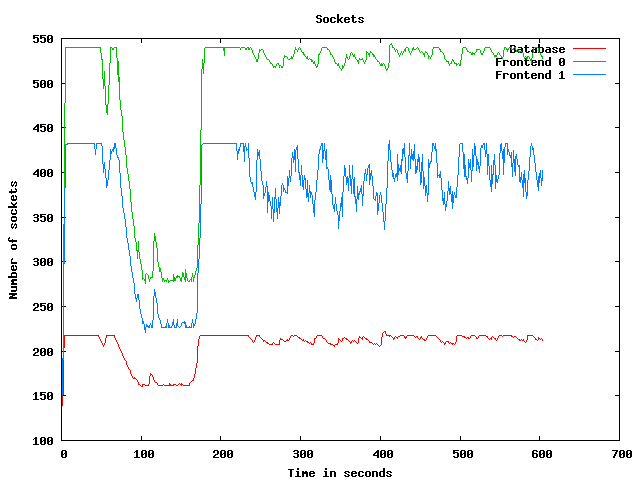
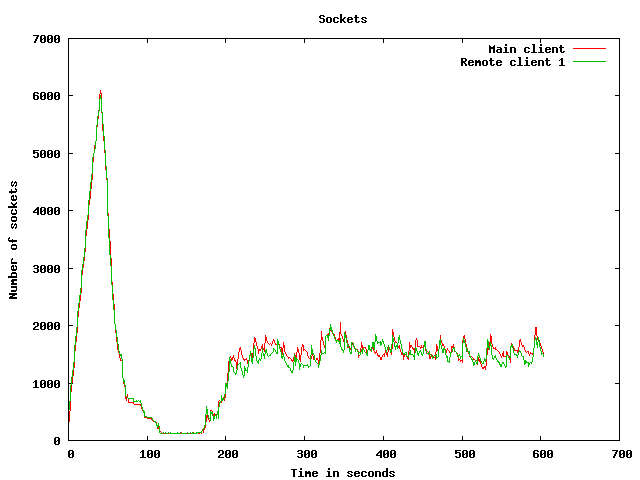
Disk usage graphs
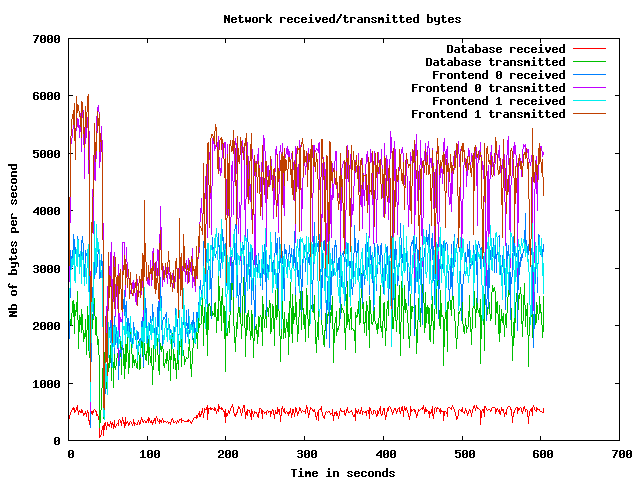
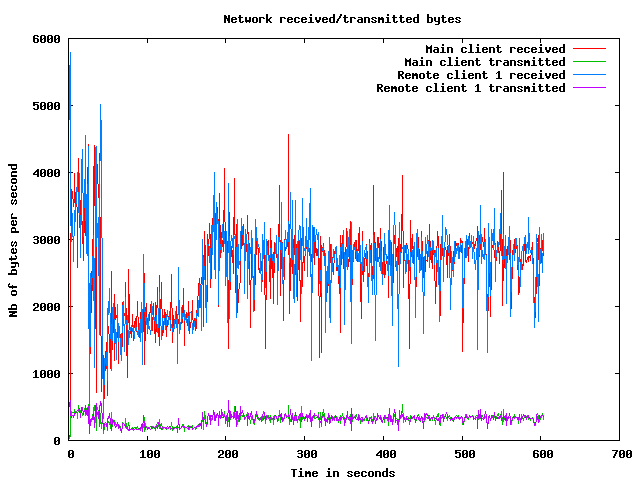
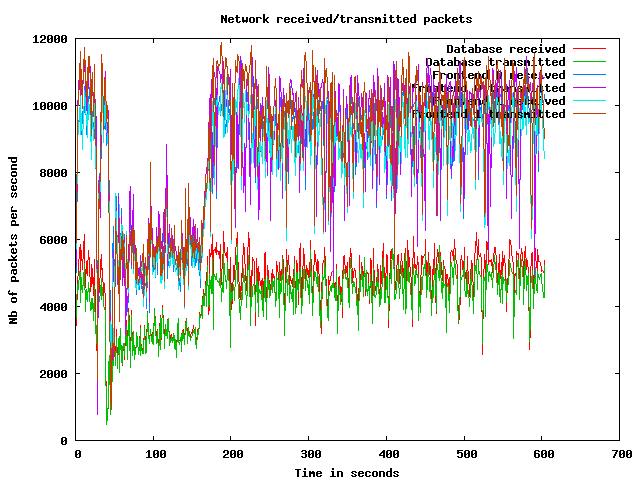
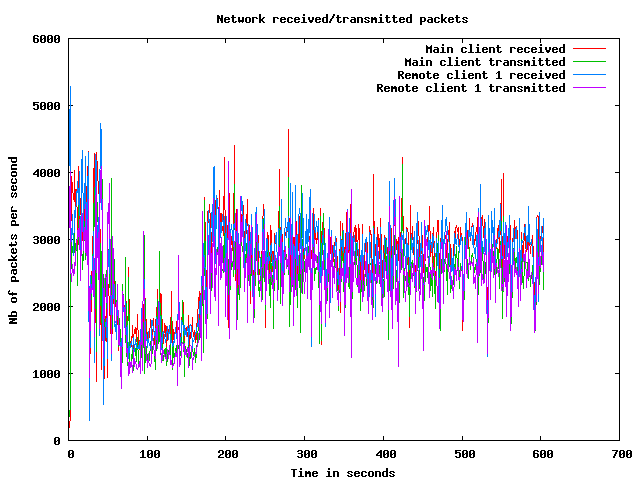
Network usage graphs
| Test start | 2009-3-20 6:11:54 |
| Up ramp start | 2009-3-20 6:12:39 |
| Runtime session start | 2009-3-20 6:14:39 |
| Down ramp start | 2009-3-20 6:22:9 |
| Test end | 2009-3-20 6:24:56 |
| Up ramp length | 2 minutes 1 millisecond (requested 120000 ms) |
| Runtime session length | 7 minutes 30 seconds 0 millisecond (requested 450000 ms) |
| Down ramp length | 30 seconds 1 millisecond (requested 30000 ms) |
| Total test length | 13 minutes 1 second 520 milliseconds |
| State name | % of total | Count | Errors | Minimum Time | Maximum Time | Average Time |
|---|---|---|---|---|---|---|
Home | 9 % | 9509 | 0 | 0 ms | 93718 ms | 7593 ms
|
Register | 1 % | 1403 | 0 | 0 ms | 93761 ms | 2359 ms
|
RegisterUser | 1 % | 1307 | 50 | 5 ms | 93080 ms | 2333 ms
|
Browse | 9 % | 9617 | 0 | 0 ms | 93760 ms | 2616 ms
|
BrowseCategories | 6 % | 6313 | 0 | 3 ms | 93140 ms | 2135 ms
|
SearchItemsInCategory | 14 % | 14563 | 0 | 3 ms | 93749 ms | 1808 ms
|
BrowseRegions | 2 % | 2717 | 0 | 3 ms | 93718 ms | 2320 ms
|
BrowseCategoriesInRegion | 2 % | 2528 | 0 | 3 ms | 93044 ms | 1896 ms
|
SearchItemsInRegion | 5 % | 5205 | 0 | 0 ms | 93731 ms | 1678 ms
|
ViewItem | 12 % | 12429 | 0 | 3 ms | 94271 ms | 1839 ms
|
ViewUserInfo | 2 % | 2377 | 0 | 3 ms | 93880 ms | 2044 ms
|
ViewBidHistory | 1 % | 1190 | 0 | 3 ms | 93038 ms | 1461 ms
|
BuyNowAuth | 1 % | 1081 | 0 | 2 ms | 93504 ms | 1796 ms
|
BuyNow | 0 % | 973 | 134 | 3 ms | 93073 ms | 1357 ms
|
StoreBuyBow | 0 % | 728 | 0 | 5 ms | 93061 ms | 1221 ms
|
PutBidAuth | 4 % | 4299 | 0 | 0 ms | 93108 ms | 1722 ms
|
PutBid | 4 % | 4271 | 533 | 1 ms | 93163 ms | 1420 ms
|
StoreBid | 2 % | 2514 | 1 | 4 ms | 93143 ms | 1558 ms
|
PutCommentAuth | 0 % | 0 | 0 | 0 ms | 0 ms | 0 ms
|
PutComment | 0 % | 388 | 36 | 4 ms | 52483 ms | 937 ms
|
StoreComment | 0 % | 307 | 0 | 5 ms | 45436 ms | 1454 ms
|
Sell | 0 % | 737 | 0 | 0 ms | 93033 ms | 2954 ms
|
SelectCategoryToSellItem | 0 % | 681 | 0 | 3 ms | 93078 ms | 2054 ms
|
SellItemForm | 0 % | 630 | 0 | 2 ms | 93045 ms | 2878 ms
|
RegisterItem | 0 % | 585 | 0 | 4 ms | 93019 ms | 2309 ms
|
AboutMe (auth form) | 2 % | 2151 | 0 | 0 ms | 93858 ms | 3158 ms
|
AboutMe | 2 % | 2964 | 0 | 4 ms | 93747 ms | 1946 ms
|
Back probability | 7 % | 7947 | 0 | 0 ms | 0 ms | 0 ms
|
End of Session | 1 % | 1132 | 0 | 0 ms | 0 ms | 0 ms
|
Total | 100 % | 100546 | 754 | - | - | 2314 ms
|
Average throughput | 844 req/s
| |||||
Completed sessions | 1025
| |||||
Total time | 58652 seconds
| |||||
Average session time | 57 seconds
| |||||
| State name | % of total | Count | Errors | Minimum Time | Maximum Time | Average Time |
|---|---|---|---|---|---|---|
Home | 4 % | 14154 | 0 | 0 ms | 236152 ms | 881 ms
|
Register | 1 % | 3617 | 0 | 0 ms | 213328 ms | 1782 ms
|
RegisterUser | 1 % | 3571 | 120 | 6 ms | 288058 ms | 1795 ms
|
Browse | 7 % | 23885 | 0 | 0 ms | 241831 ms | 1736 ms
|
BrowseCategories | 4 % | 16609 | 0 | 3 ms | 340228 ms | 1735 ms
|
SearchItemsInCategory | 15 % | 52241 | 0 | 3 ms | 380029 ms | 1778 ms
|
BrowseRegions | 2 % | 7021 | 0 | 3 ms | 340512 ms | 1377 ms
|
BrowseCategoriesInRegion | 2 % | 6896 | 0 | 3 ms | 239812 ms | 1837 ms
|
SearchItemsInRegion | 5 % | 17867 | 0 | 0 ms | 390352 ms | 1762 ms
|
ViewItem | 14 % | 48029 | 0 | 3 ms | 364112 ms | 1763 ms
|
ViewUserInfo | 3 % | 11175 | 0 | 3 ms | 380093 ms | 1769 ms
|
ViewBidHistory | 1 % | 5964 | 0 | 4 ms | 238286 ms | 2223 ms
|
BuyNowAuth | 1 % | 4586 | 0 | 2 ms | 211516 ms | 1958 ms
|
BuyNow | 1 % | 4500 | 565 | 5 ms | 212150 ms | 2029 ms
|
StoreBuyBow | 1 % | 3875 | 4 | 4 ms | 244474 ms | 1637 ms
|
PutBidAuth | 5 % | 17047 | 0 | 0 ms | 262964 ms | 2015 ms
|
PutBid | 5 % | 19751 | 2113 | 4 ms | 236505 ms | 1637 ms
|
StoreBid | 3 % | 13080 | 9 | 5 ms | 236892 ms | 1809 ms
|
PutCommentAuth | 0 % | 0 | 0 | 0 ms | 0 ms | 0 ms
|
PutComment | 0 % | 1704 | 126 | 5 ms | 190094 ms | 1706 ms
|
StoreComment | 0 % | 1555 | 0 | 5 ms | 190074 ms | 1691 ms
|
Sell | 0 % | 1939 | 0 | 0 ms | 364101 ms | 2279 ms
|
SelectCategoryToSellItem | 0 % | 1903 | 0 | 4 ms | 213288 ms | 1566 ms
|
SellItemForm | 0 % | 1877 | 0 | 2 ms | 202266 ms | 1594 ms
|
RegisterItem | 0 % | 1835 | 0 | 4 ms | 213319 ms | 2275 ms
|
AboutMe (auth form) | 1 % | 5672 | 0 | 0 ms | 206539 ms | 1143 ms
|
AboutMe | 2 % | 9546 | 0 | 4 ms | 380278 ms | 1878 ms
|
Back probability | 10 % | 35772 | 0 | 0 ms | 0 ms | 0 ms
|
End of Session | 1 % | 5098 | 0 | 0 ms | 0 ms | 0 ms
|
Total | 100 % | 340769 | 2937 | - | - | 1511 ms
|
Average throughput | 763 req/s
| |||||
Completed sessions | 5109
| |||||
Total time | 1371966 seconds
| |||||
Average session time | 268 seconds
| |||||
| State name | % of total | Count | Errors | Minimum Time | Maximum Time | Average Time |
|---|---|---|---|---|---|---|
Home | 3 % | 478 | 0 | 0 ms | 190021 ms | 2107 ms
|
Register | 1 % | 137 | 0 | 0 ms | 235078 ms | 8165 ms
|
RegisterUser | 1 % | 149 | 7 | 5 ms | 211736 ms | 5591 ms
|
Browse | 7 % | 992 | 0 | 0 ms | 283013 ms | 7362 ms
|
BrowseCategories | 5 % | 676 | 0 | 3 ms | 285136 ms | 6860 ms
|
SearchItemsInCategory | 14 % | 2011 | 0 | 3 ms | 285246 ms | 7333 ms
|
BrowseRegions | 1 % | 261 | 0 | 3 ms | 285121 ms | 6102 ms
|
BrowseCategoriesInRegion | 1 % | 259 | 0 | 3 ms | 190071 ms | 4648 ms
|
SearchItemsInRegion | 5 % | 685 | 0 | 0 ms | 235111 ms | 7592 ms
|
ViewItem | 14 % | 1911 | 0 | 3 ms | 380007 ms | 7268 ms
|
ViewUserInfo | 3 % | 458 | 0 | 3 ms | 285259 ms | 6342 ms
|
ViewBidHistory | 1 % | 215 | 0 | 3 ms | 285241 ms | 10544 ms
|
BuyNowAuth | 1 % | 207 | 0 | 2 ms | 285124 ms | 6667 ms
|
BuyNow | 1 % | 208 | 23 | 5 ms | 235126 ms | 6785 ms
|
StoreBuyBow | 1 % | 160 | 0 | 5 ms | 224931 ms | 4256 ms
|
PutBidAuth | 4 % | 642 | 0 | 0 ms | 285118 ms | 7723 ms
|
PutBid | 5 % | 782 | 59 | 4 ms | 401560 ms | 6982 ms
|
StoreBid | 3 % | 507 | 0 | 5 ms | 285798 ms | 8508 ms
|
PutCommentAuth | 0 % | 0 | 0 | 0 ms | 0 ms | 0 ms
|
PutComment | 0 % | 65 | 2 | 5 ms | 93027 ms | 3014 ms
|
StoreComment | 0 % | 60 | 0 | 5 ms | 93448 ms | 5004 ms
|
Sell | 0 % | 76 | 0 | 0 ms | 94407 ms | 3009 ms
|
SelectCategoryToSellItem | 0 % | 72 | 0 | 4 ms | 190012 ms | 10263 ms
|
SellItemForm | 0 % | 74 | 0 | 2 ms | 228061 ms | 14486 ms
|
RegisterItem | 0 % | 83 | 0 | 5 ms | 94398 ms | 4797 ms
|
AboutMe (auth form) | 1 % | 223 | 0 | 0 ms | 283005 ms | 10936 ms
|
AboutMe | 2 % | 383 | 0 | 4 ms | 235069 ms | 5626 ms
|
Back probability | 11 % | 1483 | 0 | 0 ms | 0 ms | 0 ms
|
End of Session | 1 % | 193 | 0 | 0 ms | 0 ms | 0 ms
|
Total | 100 % | 13450 | 91 | - | - | 6088 ms
|
Average throughput | 451 req/s
| |||||
Completed sessions | 189
| |||||
Total time | 70731 seconds
| |||||
Average session time | 374 seconds
| |||||
| State name | % of total | Count | Errors | Minimum Time | Maximum Time | Average Time |
|---|---|---|---|---|---|---|
Home | 5 % | 24143 | 0 | 0 ms | 236152 ms | 3556 ms
|
Register | 1 % | 5158 | 0 | 0 ms | 235078 ms | 2108 ms
|
RegisterUser | 1 % | 5027 | 177 | 5 ms | 288058 ms | 2084 ms
|
Browse | 7 % | 34506 | 0 | 0 ms | 379995 ms | 2233 ms
|
BrowseCategories | 5 % | 23611 | 0 | 3 ms | 340228 ms | 2060 ms
|
SearchItemsInCategory | 15 % | 69166 | 0 | 3 ms | 380029 ms | 2021 ms
|
BrowseRegions | 2 % | 10006 | 0 | 3 ms | 340512 ms | 1897 ms
|
BrowseCategoriesInRegion | 2 % | 9693 | 0 | 3 ms | 283051 ms | 2013 ms
|
SearchItemsInRegion | 5 % | 23842 | 0 | 0 ms | 390352 ms | 2023 ms
|
ViewItem | 13 % | 62537 | 0 | 3 ms | 380738 ms | 2083 ms
|
ViewUserInfo | 3 % | 14064 | 0 | 3 ms | 380093 ms | 2065 ms
|
ViewBidHistory | 1 % | 7395 | 0 | 3 ms | 380746 ms | 2526 ms
|
BuyNowAuth | 1 % | 5879 | 0 | 2 ms | 285124 ms | 2188 ms
|
BuyNow | 1 % | 5685 | 722 | 3 ms | 235126 ms | 2202 ms
|
StoreBuyBow | 1 % | 4768 | 4 | 4 ms | 283059 ms | 1759 ms
|
PutBidAuth | 4 % | 22002 | 0 | 0 ms | 380003 ms | 2269 ms
|
PutBid | 5 % | 24900 | 2706 | 1 ms | 401560 ms | 1887 ms
|
StoreBid | 3 % | 16111 | 10 | 4 ms | 285798 ms | 2096 ms
|
PutCommentAuth | 0 % | 0 | 0 | 0 ms | 0 ms | 0 ms
|
PutComment | 0 % | 2159 | 164 | 4 ms | 380750 ms | 1870 ms
|
StoreComment | 0 % | 1924 | 0 | 5 ms | 190074 ms | 1853 ms
|
Sell | 0 % | 2754 | 0 | 0 ms | 364101 ms | 2580 ms
|
SelectCategoryToSellItem | 0 % | 2658 | 0 | 3 ms | 213288 ms | 2067 ms
|
SellItemForm | 0 % | 2584 | 0 | 2 ms | 228061 ms | 2421 ms
|
RegisterItem | 0 % | 2505 | 0 | 4 ms | 380742 ms | 2743 ms
|
AboutMe (auth form) | 1 % | 8058 | 0 | 0 ms | 283005 ms | 2009 ms
|
AboutMe | 2 % | 12988 | 0 | 4 ms | 380278 ms | 2099 ms
|
Back probability | 9 % | 45245 | 0 | 0 ms | 0 ms | 0 ms
|
End of Session | 1 % | 6426 | 0 | 0 ms | 0 ms | 0 ms
|
Total | 100 % | 455794 | 3783 | - | - | 1912 ms
|
Average throughput | 765 req/s
| |||||
Completed sessions | 6426
| |||||
Total time | 1543921 seconds
| |||||
Average session time | 240 seconds
| |||||
An error occured while waiting for remote processes termination (Skipping waits)
Command is: /usr/bin/scp farm6.csail.mit.edu:/tmp/client1 /home/drkp/sandbox/txcache/src/RUBiS-1.4.3/bench/2009-3-20@6:11:54//client1.bin
Command is: /usr/bin/ssh -x localhost /bin/bash -c 'LANG=en_GB.UTF-8 /usr/bin/sar -n DEV -n SOCK -rubcw 1 605 -f /home/drkp/sandbox/txcache/src/RUBiS-1.4.3/bench/2009-3-20@6:11:54//client1.bin > /home/drkp/sandbox/txcache/src/RUBiS-1.4.3/bench/2009-3-20@6:11:54//client1'
Command is: /usr/bin/scp farm14:/tmp/db_server0 /home/drkp/sandbox/txcache/src/RUBiS-1.4.3/bench/2009-3-20@6:11:54//db_server0.bin
Command is: /usr/bin/ssh -x localhost /bin/bash -c 'LANG=en_GB.UTF-8 /usr/bin/sar -n DEV -n SOCK -rubcw 1 605 -f /home/drkp/sandbox/txcache/src/RUBiS-1.4.3/bench/2009-3-20@6:11:54//db_server0.bin > /home/drkp/sandbox/txcache/src/RUBiS-1.4.3/bench/2009-3-20@6:11:54//db_server0'
Command is: /usr/bin/scp farm12.csail.mit.edu:/tmp/web_server0 /home/drkp/sandbox/txcache/src/RUBiS-1.4.3/bench/2009-3-20@6:11:54//web_server0.bin
Command is: /usr/bin/ssh -x localhost /bin/bash -c 'LANG=en_GB.UTF-8 /usr/bin/sar -n DEV -n SOCK -rubcw 1 605 -f /home/drkp/sandbox/txcache/src/RUBiS-1.4.3/bench/2009-3-20@6:11:54//web_server0.bin > /home/drkp/sandbox/txcache/src/RUBiS-1.4.3/bench/2009-3-20@6:11:54//web_server0'
Command is: /usr/bin/scp farm13.csail.mit.edu:/tmp/web_server1 /home/drkp/sandbox/txcache/src/RUBiS-1.4.3/bench/2009-3-20@6:11:54//web_server1.bin
Command is: /usr/bin/ssh -x localhost /bin/bash -c 'LANG=en_GB.UTF-8 /usr/bin/sar -n DEV -n SOCK -rubcw 1 605 -f /home/drkp/sandbox/txcache/src/RUBiS-1.4.3/bench/2009-3-20@6:11:54//web_server1.bin > /home/drkp/sandbox/txcache/src/RUBiS-1.4.3/bench/2009-3-20@6:11:54//web_server1'
Command is: /usr/bin/scp localhost:/tmp/client0 /home/drkp/sandbox/txcache/src/RUBiS-1.4.3/bench/2009-3-20@6:11:54//client0.bin
Command is: /usr/bin/ssh -x localhost /bin/bash -c 'LANG=en_GB.UTF-8 /usr/bin/sar -n DEV -n SOCK -rubcw 1 605 -f /home/drkp/sandbox/txcache/src/RUBiS-1.4.3/bench/2009-3-20@6:11:54//client0.bin > /home/drkp/sandbox/txcache/src/RUBiS-1.4.3/bench/2009-3-20@6:11:54//client0'
Command is: /usr/bin/scp farm6.csail.mit.edu:/tmp/trace_client1.html /home/drkp/sandbox/txcache/src/RUBiS-1.4.3/bench/2009-3-20@6:11:54//
Command is: /usr/bin/scp farm6.csail.mit.edu:/tmp/stat_client1.html /home/drkp/sandbox/txcache/src/RUBiS-1.4.3/bench/2009-3-20@6:11:54//
|
|
|
|
|
|
 | 
|
 | 
|
 | 
|
 | 
|
 | 
|
 | 
|
 | 
|
 | 
|
 | 
|