Node information
Test timing information
Up ramp statistics
Runtime session statistics
Down ramp statistics
Overall statistics
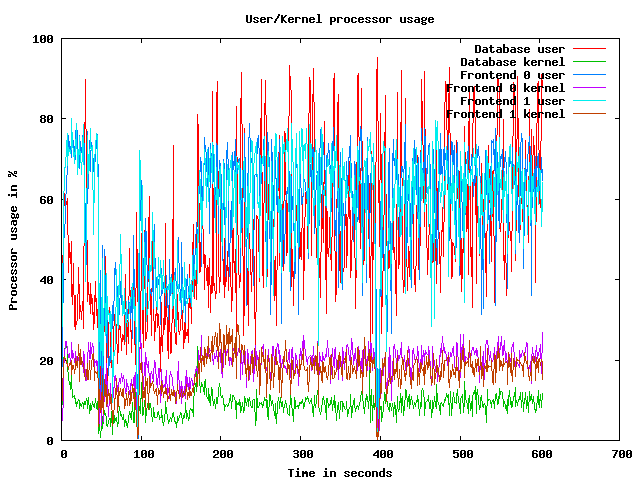
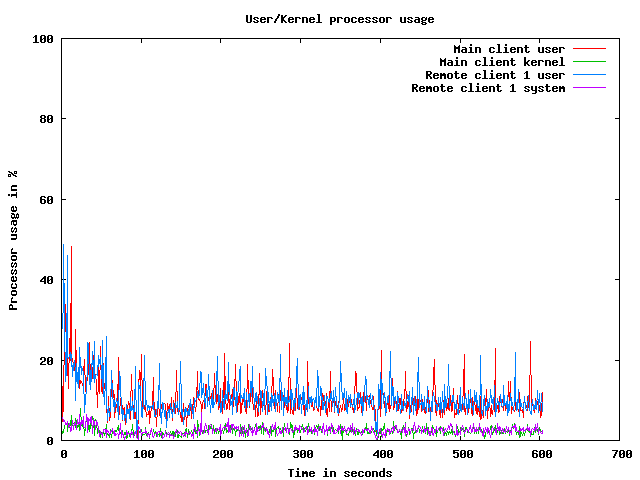
CPU usage graphs
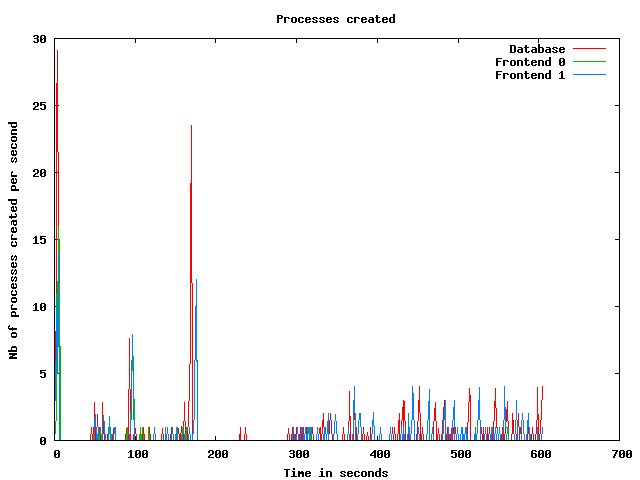
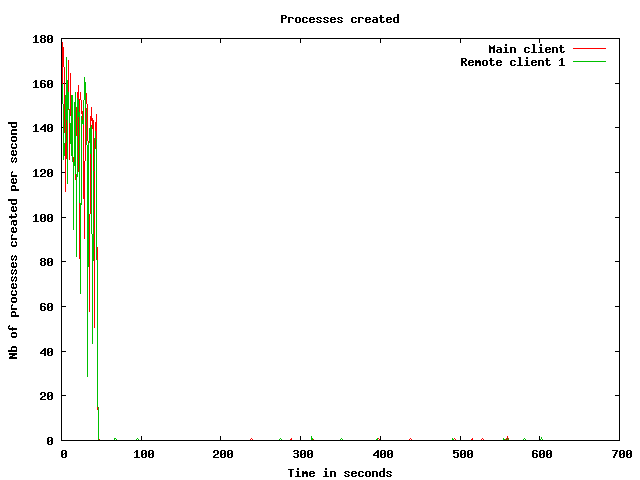
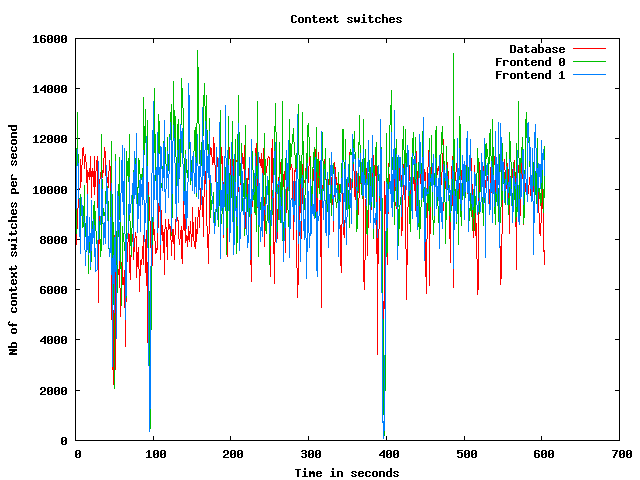
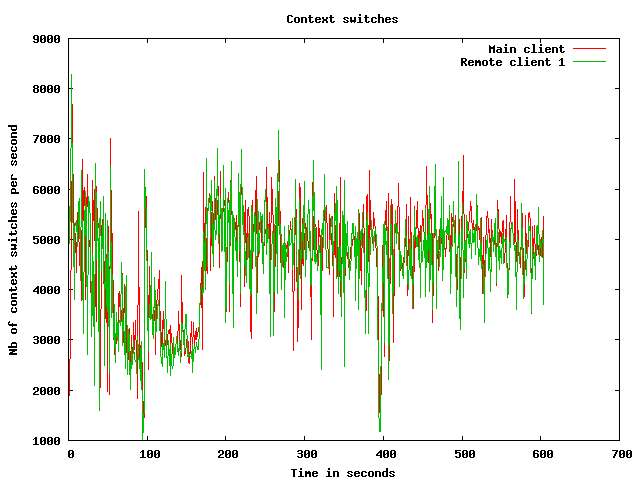
Processes usage graphs
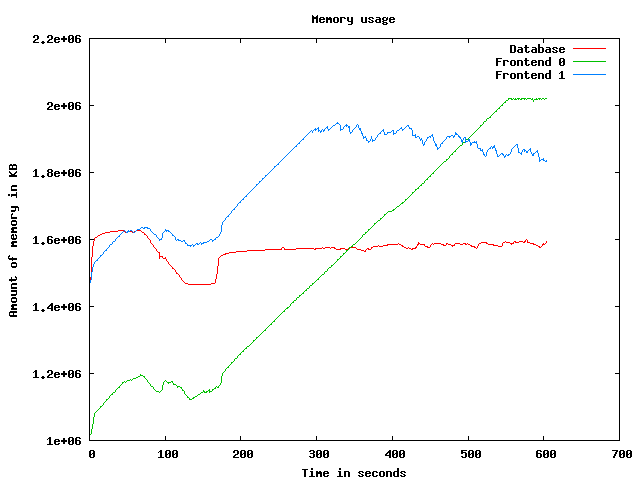
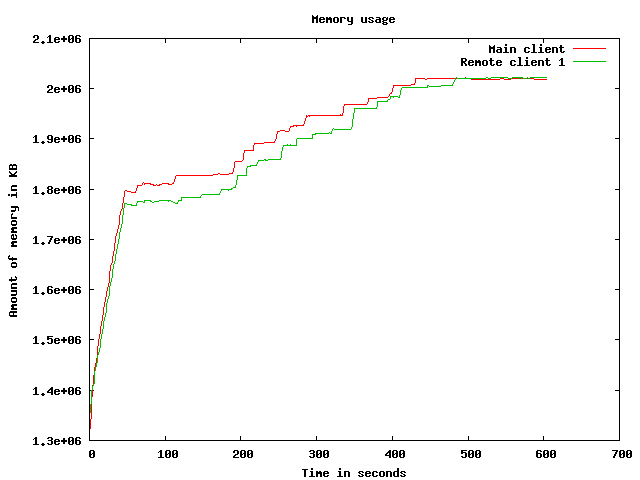
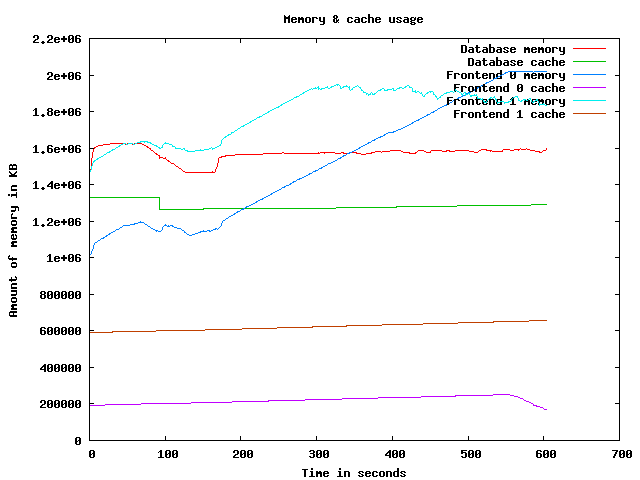
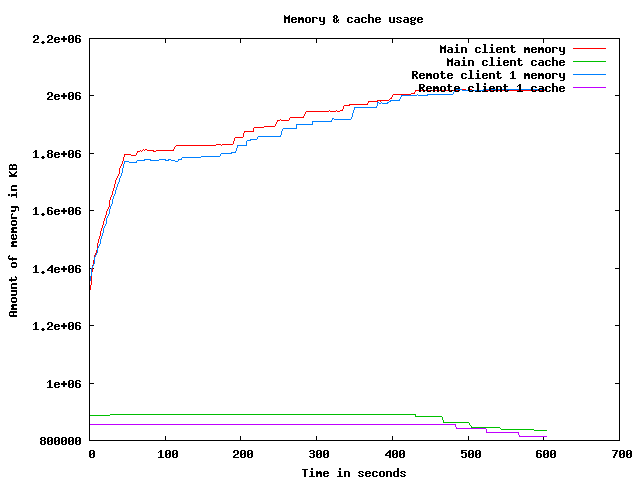
Memory usage graph
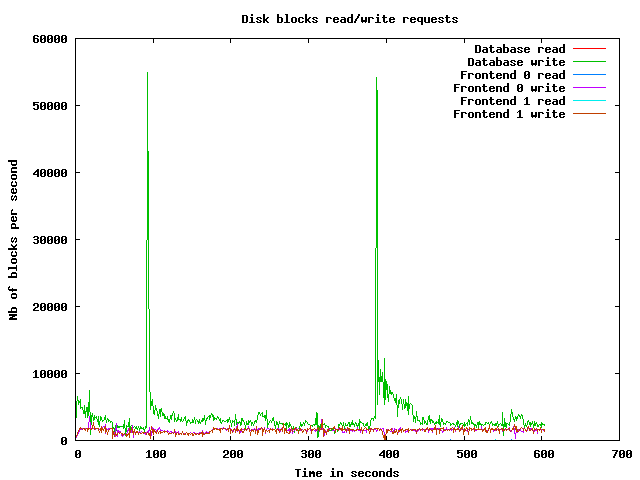
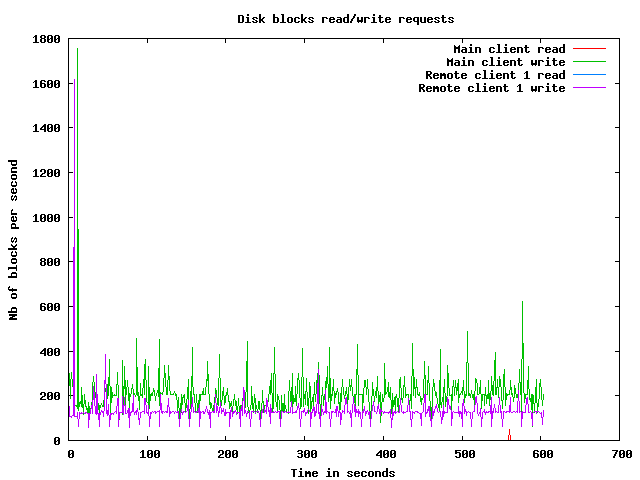
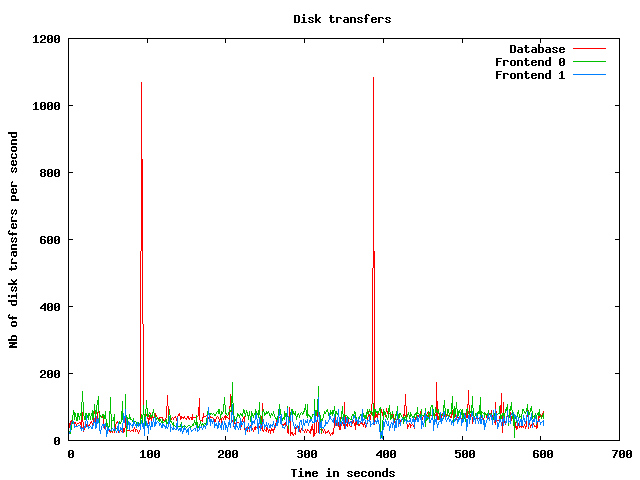
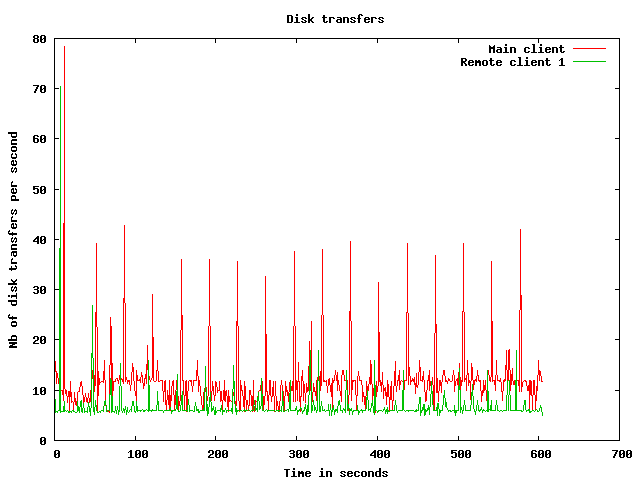
Disk usage graphs
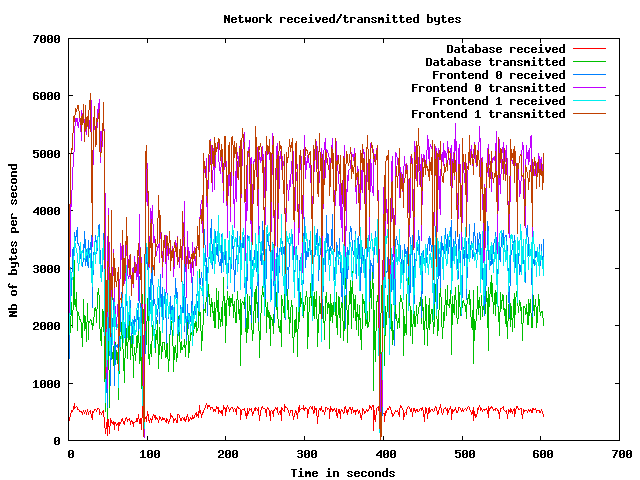
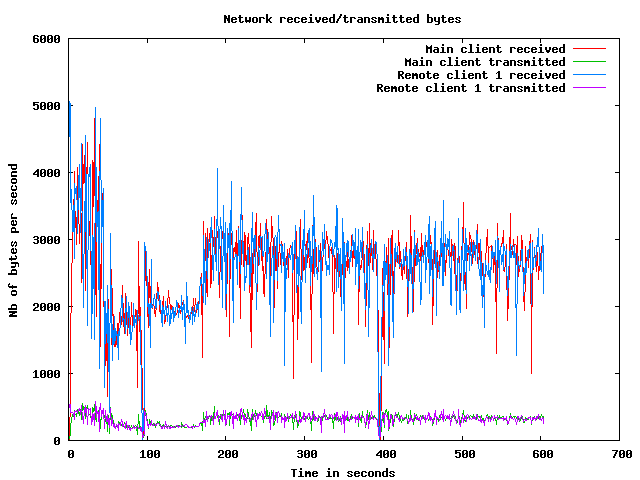
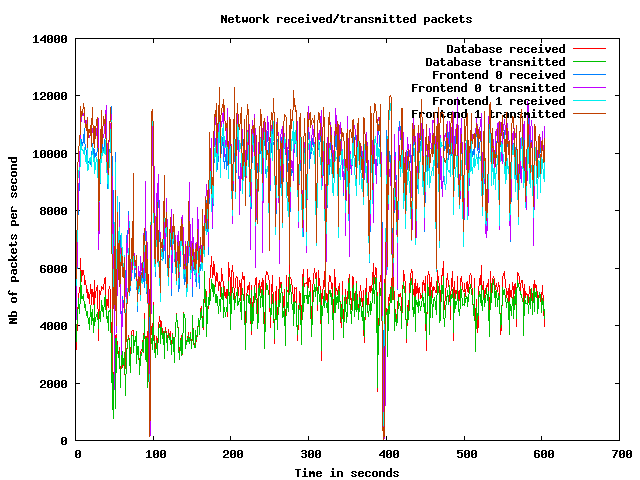
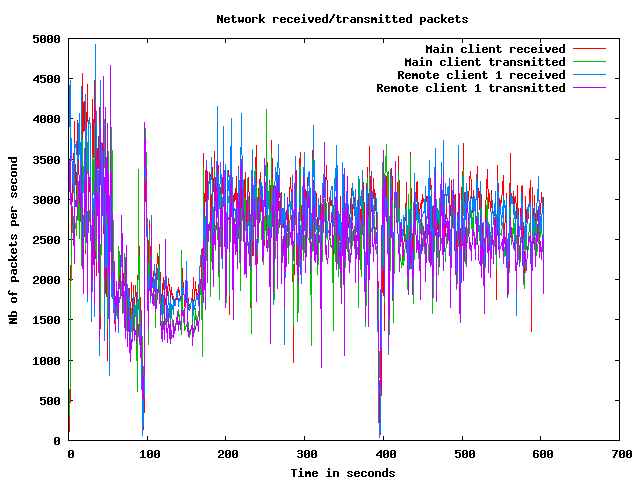
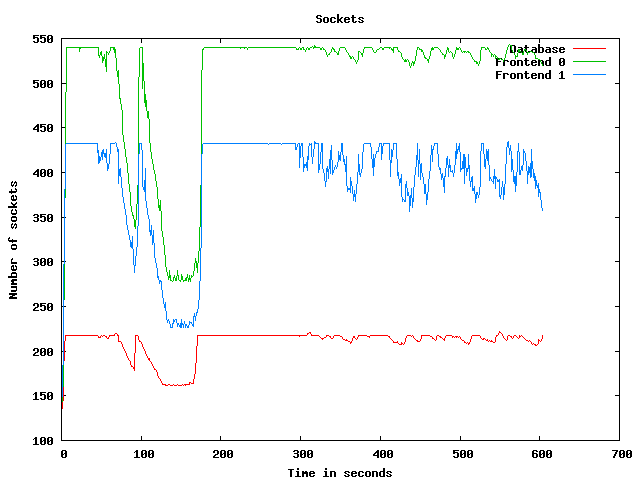
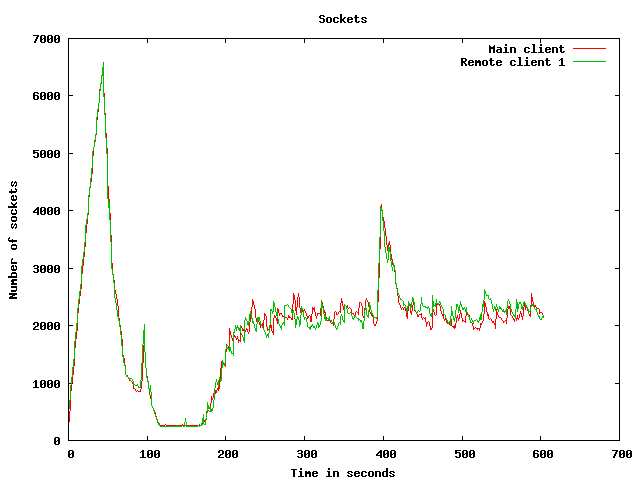
Network usage graphs
| Test start | 2009-3-20 6:25:48 |
| Up ramp start | 2009-3-20 6:26:35 |
| Runtime session start | 2009-3-20 6:28:35 |
| Down ramp start | 2009-3-20 6:36:5 |
| Test end | 2009-3-20 6:38:55 |
| Up ramp length | 2 minutes 1 millisecond (requested 120000 ms) |
| Runtime session length | 7 minutes 30 seconds 0 millisecond (requested 450000 ms) |
| Down ramp length | 30 seconds 45 milliseconds (requested 30000 ms) |
| Total test length | 13 minutes 6 seconds 516 milliseconds |
| State name | % of total | Count | Errors | Minimum Time | Maximum Time | Average Time |
|---|---|---|---|---|---|---|
Home | 9 % | 9958 | 0 | 0 ms | 96392 ms | 6697 ms
|
Register | 1 % | 1450 | 0 | 0 ms | 93177 ms | 2586 ms
|
RegisterUser | 1 % | 1350 | 45 | 5 ms | 93375 ms | 2314 ms
|
Browse | 9 % | 10194 | 0 | 0 ms | 93413 ms | 3063 ms
|
BrowseCategories | 6 % | 6827 | 0 | 3 ms | 94467 ms | 2515 ms
|
SearchItemsInCategory | 14 % | 15995 | 0 | 3 ms | 93694 ms | 2067 ms
|
BrowseRegions | 2 % | 2727 | 0 | 3 ms | 93080 ms | 2068 ms
|
BrowseCategoriesInRegion | 2 % | 2539 | 0 | 3 ms | 93404 ms | 2325 ms
|
SearchItemsInRegion | 4 % | 5200 | 0 | 0 ms | 93213 ms | 2043 ms
|
ViewItem | 12 % | 13573 | 0 | 3 ms | 93534 ms | 1894 ms
|
ViewUserInfo | 2 % | 2478 | 0 | 3 ms | 95074 ms | 1920 ms
|
ViewBidHistory | 1 % | 1306 | 0 | 3 ms | 93516 ms | 1942 ms
|
BuyNowAuth | 1 % | 1162 | 0 | 2 ms | 93001 ms | 1180 ms
|
BuyNow | 0 % | 1037 | 128 | 3 ms | 93425 ms | 1411 ms
|
StoreBuyBow | 0 % | 784 | 0 | 4 ms | 93022 ms | 1999 ms
|
PutBidAuth | 4 % | 4767 | 0 | 0 ms | 93525 ms | 1561 ms
|
PutBid | 4 % | 4744 | 541 | 0 ms | 95033 ms | 1733 ms
|
StoreBid | 2 % | 2839 | 1 | 5 ms | 93064 ms | 1175 ms
|
PutCommentAuth | 0 % | 0 | 0 | 0 ms | 0 ms | 0 ms
|
PutComment | 0 % | 420 | 29 | 4 ms | 65510 ms | 1468 ms
|
StoreComment | 0 % | 359 | 0 | 5 ms | 59108 ms | 987 ms
|
Sell | 0 % | 754 | 0 | 0 ms | 93349 ms | 3466 ms
|
SelectCategoryToSellItem | 0 % | 709 | 0 | 4 ms | 93491 ms | 2873 ms
|
SellItemForm | 0 % | 663 | 0 | 2 ms | 93016 ms | 1680 ms
|
RegisterItem | 0 % | 600 | 0 | 4 ms | 93005 ms | 2417 ms
|
AboutMe (auth form) | 2 % | 2344 | 0 | 0 ms | 93518 ms | 2844 ms
|
AboutMe | 3 % | 3251 | 0 | 4 ms | 93521 ms | 2546 ms
|
Back probability | 7 % | 8617 | 0 | 0 ms | 0 ms | 0 ms
|
End of Session | 1 % | 1195 | 0 | 0 ms | 0 ms | 0 ms
|
Total | 100 % | 107842 | 744 | - | - | 2364 ms
|
Average throughput | 904 req/s
| |||||
Completed sessions | 1083
| |||||
Total time | 64187 seconds
| |||||
Average session time | 59 seconds
| |||||
| State name | % of total | Count | Errors | Minimum Time | Maximum Time | Average Time |
|---|---|---|---|---|---|---|
Home | 4 % | 13576 | 0 | 0 ms | 390110 ms | 2243 ms
|
Register | 1 % | 3457 | 0 | 0 ms | 505496 ms | 3357 ms
|
RegisterUser | 1 % | 3399 | 136 | 5 ms | 401984 ms | 3218 ms
|
Browse | 7 % | 23032 | 0 | 0 ms | 592384 ms | 2833 ms
|
BrowseCategories | 4 % | 16037 | 0 | 3 ms | 501251 ms | 2676 ms
|
SearchItemsInCategory | 15 % | 50624 | 0 | 3 ms | 402125 ms | 2651 ms
|
BrowseRegions | 2 % | 6731 | 0 | 3 ms | 385296 ms | 2524 ms
|
BrowseCategoriesInRegion | 2 % | 6627 | 0 | 3 ms | 402127 ms | 2606 ms
|
SearchItemsInRegion | 5 % | 17168 | 0 | 0 ms | 387170 ms | 2614 ms
|
ViewItem | 14 % | 46201 | 0 | 3 ms | 387162 ms | 2782 ms
|
ViewUserInfo | 3 % | 11125 | 0 | 3 ms | 347441 ms | 2582 ms
|
ViewBidHistory | 1 % | 5848 | 0 | 3 ms | 411827 ms | 3448 ms
|
BuyNowAuth | 1 % | 4373 | 0 | 2 ms | 333401 ms | 2899 ms
|
BuyNow | 1 % | 4308 | 565 | 5 ms | 403204 ms | 2616 ms
|
StoreBuyBow | 1 % | 3697 | 4 | 4 ms | 401994 ms | 2646 ms
|
PutBidAuth | 4 % | 16304 | 0 | 0 ms | 384479 ms | 2602 ms
|
PutBid | 5 % | 18903 | 1930 | 4 ms | 396893 ms | 2718 ms
|
StoreBid | 3 % | 12574 | 15 | 5 ms | 380059 ms | 2630 ms
|
PutCommentAuth | 0 % | 0 | 0 | 0 ms | 0 ms | 0 ms
|
PutComment | 0 % | 1683 | 113 | 4 ms | 249899 ms | 2589 ms
|
StoreComment | 0 % | 1548 | 0 | 4 ms | 387087 ms | 3007 ms
|
Sell | 0 % | 1755 | 0 | 0 ms | 237071 ms | 2478 ms
|
SelectCategoryToSellItem | 0 % | 1712 | 0 | 4 ms | 263017 ms | 1998 ms
|
SellItemForm | 0 % | 1682 | 0 | 2 ms | 212649 ms | 2323 ms
|
RegisterItem | 0 % | 1659 | 0 | 4 ms | 236573 ms | 2679 ms
|
AboutMe (auth form) | 1 % | 5503 | 0 | 0 ms | 387113 ms | 2729 ms
|
AboutMe | 2 % | 9303 | 0 | 4 ms | 380299 ms | 2858 ms
|
Back probability | 10 % | 34770 | 0 | 0 ms | 0 ms | 0 ms
|
End of Session | 1 % | 4983 | 0 | 0 ms | 0 ms | 0 ms
|
Total | 100 % | 328582 | 2763 | - | - | 2352 ms
|
Average throughput | 736 req/s
| |||||
Completed sessions | 5021
| |||||
Total time | 1384206 seconds
| |||||
Average session time | 275 seconds
| |||||
| State name | % of total | Count | Errors | Minimum Time | Maximum Time | Average Time |
|---|---|---|---|---|---|---|
Home | 3 % | 533 | 0 | 0 ms | 190017 ms | 2315 ms
|
Register | 0 % | 125 | 0 | 0 ms | 190000 ms | 8256 ms
|
RegisterUser | 0 % | 134 | 8 | 6 ms | 93516 ms | 5608 ms
|
Browse | 7 % | 957 | 0 | 0 ms | 379997 ms | 8221 ms
|
BrowseCategories | 4 % | 655 | 0 | 3 ms | 283005 ms | 8635 ms
|
SearchItemsInCategory | 15 % | 2069 | 0 | 3 ms | 428594 ms | 9200 ms
|
BrowseRegions | 1 % | 242 | 0 | 3 ms | 235503 ms | 8655 ms
|
BrowseCategoriesInRegion | 1 % | 271 | 0 | 3 ms | 380614 ms | 11551 ms
|
SearchItemsInRegion | 4 % | 659 | 0 | 0 ms | 384024 ms | 9632 ms
|
ViewItem | 14 % | 1977 | 0 | 3 ms | 383899 ms | 6837 ms
|
ViewUserInfo | 3 % | 444 | 0 | 3 ms | 283356 ms | 8201 ms
|
ViewBidHistory | 1 % | 239 | 0 | 4 ms | 386839 ms | 9739 ms
|
BuyNowAuth | 1 % | 188 | 0 | 2 ms | 93303 ms | 3617 ms
|
BuyNow | 1 % | 191 | 31 | 5 ms | 236189 ms | 6264 ms
|
StoreBuyBow | 1 % | 147 | 0 | 5 ms | 283349 ms | 7002 ms
|
PutBidAuth | 5 % | 719 | 0 | 0 ms | 235758 ms | 6985 ms
|
PutBid | 6 % | 835 | 72 | 4 ms | 347496 ms | 9170 ms
|
StoreBid | 4 % | 587 | 1 | 5 ms | 235746 ms | 9448 ms
|
PutCommentAuth | 0 % | 0 | 0 | 0 ms | 0 ms | 0 ms
|
PutComment | 0 % | 59 | 3 | 5 ms | 47765 ms | 3665 ms
|
StoreComment | 0 % | 55 | 0 | 5 ms | 99185 ms | 9605 ms
|
Sell | 0 % | 79 | 0 | 0 ms | 93486 ms | 6831 ms
|
SelectCategoryToSellItem | 0 % | 77 | 0 | 4 ms | 235048 ms | 8209 ms
|
SellItemForm | 0 % | 75 | 0 | 2 ms | 250776 ms | 12152 ms
|
RegisterItem | 0 % | 69 | 0 | 5 ms | 236199 ms | 9565 ms
|
AboutMe (auth form) | 1 % | 222 | 0 | 0 ms | 190002 ms | 6594 ms
|
AboutMe | 2 % | 350 | 0 | 4 ms | 239286 ms | 7754 ms
|
Back probability | 10 % | 1441 | 0 | 0 ms | 0 ms | 0 ms
|
End of Session | 1 % | 232 | 0 | 0 ms | 0 ms | 0 ms
|
Total | 100 % | 13631 | 115 | - | - | 6942 ms
|
Average throughput | 457 req/s
| |||||
Completed sessions | 192
| |||||
Total time | 75921 seconds
| |||||
Average session time | 395 seconds
| |||||
| State name | % of total | Count | Errors | Minimum Time | Maximum Time | Average Time |
|---|---|---|---|---|---|---|
Home | 5 % | 24069 | 0 | 0 ms | 473036 ms | 4205 ms
|
Register | 1 % | 5040 | 0 | 0 ms | 505496 ms | 3515 ms
|
RegisterUser | 1 % | 4891 | 189 | 5 ms | 401984 ms | 3163 ms
|
Browse | 7 % | 34237 | 0 | 0 ms | 592384 ms | 3290 ms
|
BrowseCategories | 5 % | 23551 | 0 | 3 ms | 663236 ms | 3106 ms
|
SearchItemsInCategory | 15 % | 69109 | 0 | 3 ms | 428594 ms | 2968 ms
|
BrowseRegions | 2 % | 9714 | 0 | 3 ms | 473027 ms | 2960 ms
|
BrowseCategoriesInRegion | 2 % | 9456 | 0 | 3 ms | 402127 ms | 3233 ms
|
SearchItemsInRegion | 5 % | 23157 | 0 | 0 ms | 473028 ms | 2973 ms
|
ViewItem | 13 % | 61997 | 0 | 3 ms | 387162 ms | 2978 ms
|
ViewUserInfo | 3 % | 14107 | 0 | 3 ms | 380030 ms | 2876 ms
|
ViewBidHistory | 1 % | 7428 | 0 | 3 ms | 411827 ms | 3611 ms
|
BuyNowAuth | 1 % | 5736 | 0 | 2 ms | 473039 ms | 2755 ms
|
BuyNow | 1 % | 5542 | 725 | 3 ms | 403204 ms | 2667 ms
|
StoreBuyBow | 1 % | 4635 | 4 | 4 ms | 401994 ms | 2976 ms
|
PutBidAuth | 4 % | 21830 | 0 | 0 ms | 384479 ms | 2670 ms
|
PutBid | 5 % | 24577 | 2544 | 0 ms | 396893 ms | 2984 ms
|
StoreBid | 3 % | 16026 | 17 | 5 ms | 380059 ms | 2925 ms
|
PutCommentAuth | 0 % | 0 | 0 | 0 ms | 0 ms | 0 ms
|
PutComment | 0 % | 2169 | 145 | 4 ms | 249899 ms | 2524 ms
|
StoreComment | 0 % | 1964 | 0 | 4 ms | 387087 ms | 3110 ms
|
Sell | 0 % | 2590 | 0 | 0 ms | 237071 ms | 3260 ms
|
SelectCategoryToSellItem | 0 % | 2504 | 0 | 4 ms | 380091 ms | 2771 ms
|
SellItemForm | 0 % | 2425 | 0 | 2 ms | 250776 ms | 2680 ms
|
RegisterItem | 0 % | 2332 | 0 | 4 ms | 236573 ms | 3339 ms
|
AboutMe (auth form) | 1 % | 8082 | 0 | 0 ms | 387113 ms | 3171 ms
|
AboutMe | 2 % | 13000 | 0 | 4 ms | 473037 ms | 3142 ms
|
Back probability | 9 % | 44902 | 0 | 0 ms | 0 ms | 0 ms
|
End of Session | 1 % | 6430 | 0 | 0 ms | 0 ms | 0 ms
|
Total | 100 % | 451500 | 3624 | - | - | 2716 ms
|
Average throughput | 758 req/s
| |||||
Completed sessions | 6430
| |||||
Total time | 1581523 seconds
| |||||
Average session time | 245 seconds
| |||||
An error occured while waiting for remote processes termination (Skipping waits)
Command is: /usr/bin/scp farm6.csail.mit.edu:/tmp/client1 /home/drkp/sandbox/txcache/src/RUBiS-1.4.3/bench/2009-3-20@6:25:48//client1.bin
Command is: /usr/bin/ssh -x localhost /bin/bash -c 'LANG=en_GB.UTF-8 /usr/bin/sar -n DEV -n SOCK -rubcw 1 605 -f /home/drkp/sandbox/txcache/src/RUBiS-1.4.3/bench/2009-3-20@6:25:48//client1.bin > /home/drkp/sandbox/txcache/src/RUBiS-1.4.3/bench/2009-3-20@6:25:48//client1'
Command is: /usr/bin/scp farm14:/tmp/db_server0 /home/drkp/sandbox/txcache/src/RUBiS-1.4.3/bench/2009-3-20@6:25:48//db_server0.bin
Command is: /usr/bin/ssh -x localhost /bin/bash -c 'LANG=en_GB.UTF-8 /usr/bin/sar -n DEV -n SOCK -rubcw 1 605 -f /home/drkp/sandbox/txcache/src/RUBiS-1.4.3/bench/2009-3-20@6:25:48//db_server0.bin > /home/drkp/sandbox/txcache/src/RUBiS-1.4.3/bench/2009-3-20@6:25:48//db_server0'
Command is: /usr/bin/scp farm12.csail.mit.edu:/tmp/web_server0 /home/drkp/sandbox/txcache/src/RUBiS-1.4.3/bench/2009-3-20@6:25:48//web_server0.bin
Command is: /usr/bin/ssh -x localhost /bin/bash -c 'LANG=en_GB.UTF-8 /usr/bin/sar -n DEV -n SOCK -rubcw 1 605 -f /home/drkp/sandbox/txcache/src/RUBiS-1.4.3/bench/2009-3-20@6:25:48//web_server0.bin > /home/drkp/sandbox/txcache/src/RUBiS-1.4.3/bench/2009-3-20@6:25:48//web_server0'
Command is: /usr/bin/scp farm13.csail.mit.edu:/tmp/web_server1 /home/drkp/sandbox/txcache/src/RUBiS-1.4.3/bench/2009-3-20@6:25:48//web_server1.bin
Command is: /usr/bin/ssh -x localhost /bin/bash -c 'LANG=en_GB.UTF-8 /usr/bin/sar -n DEV -n SOCK -rubcw 1 605 -f /home/drkp/sandbox/txcache/src/RUBiS-1.4.3/bench/2009-3-20@6:25:48//web_server1.bin > /home/drkp/sandbox/txcache/src/RUBiS-1.4.3/bench/2009-3-20@6:25:48//web_server1'
Command is: /usr/bin/scp localhost:/tmp/client0 /home/drkp/sandbox/txcache/src/RUBiS-1.4.3/bench/2009-3-20@6:25:48//client0.bin
Command is: /usr/bin/ssh -x localhost /bin/bash -c 'LANG=en_GB.UTF-8 /usr/bin/sar -n DEV -n SOCK -rubcw 1 605 -f /home/drkp/sandbox/txcache/src/RUBiS-1.4.3/bench/2009-3-20@6:25:48//client0.bin > /home/drkp/sandbox/txcache/src/RUBiS-1.4.3/bench/2009-3-20@6:25:48//client0'
Command is: /usr/bin/scp farm6.csail.mit.edu:/tmp/trace_client1.html /home/drkp/sandbox/txcache/src/RUBiS-1.4.3/bench/2009-3-20@6:25:48//
Command is: /usr/bin/scp farm6.csail.mit.edu:/tmp/stat_client1.html /home/drkp/sandbox/txcache/src/RUBiS-1.4.3/bench/2009-3-20@6:25:48//
|
|
|
|
|
|
 | 
|
 | 
|
 | 
|
 | 
|
 | 
|
 | 
|
 | 
|
 | 
|
 | 
|