Node information
Test timing information
Up ramp statistics
Runtime session statistics
Down ramp statistics
Overall statistics
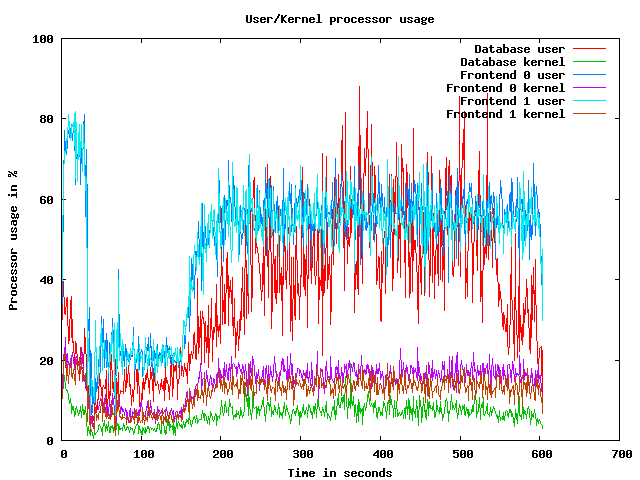
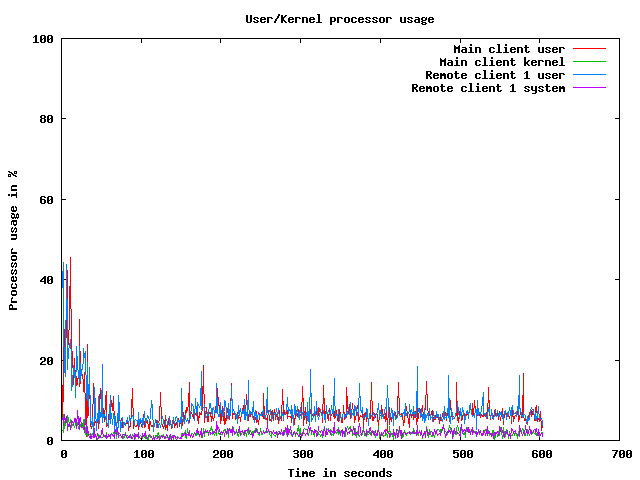
CPU usage graphs
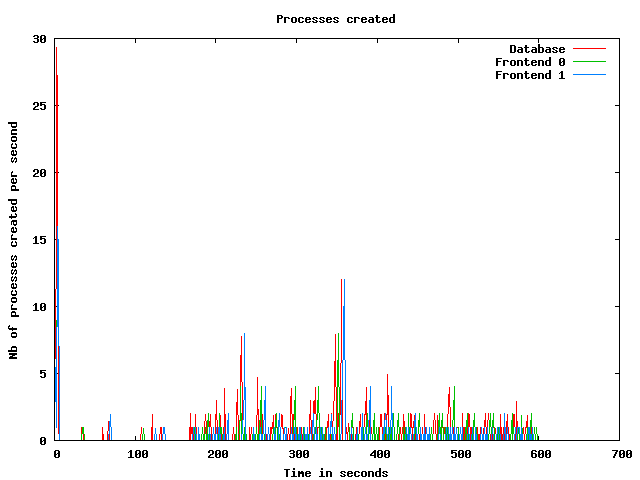
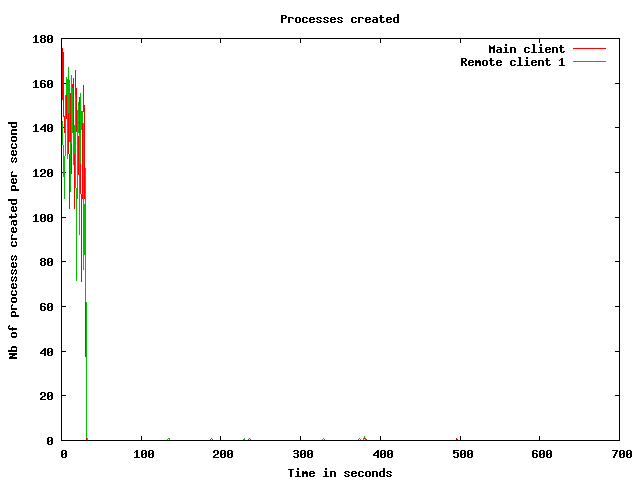
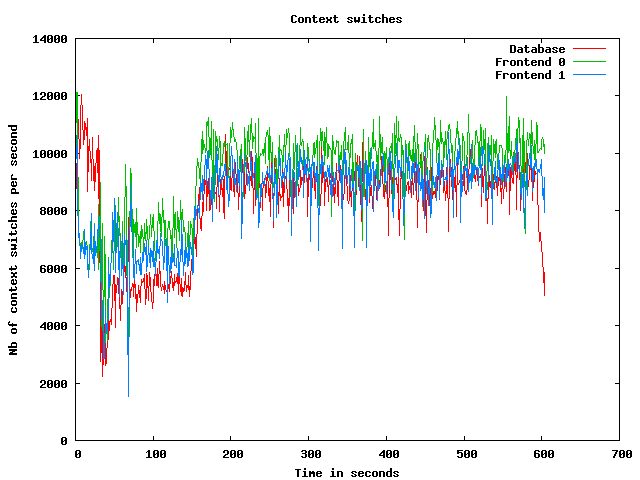
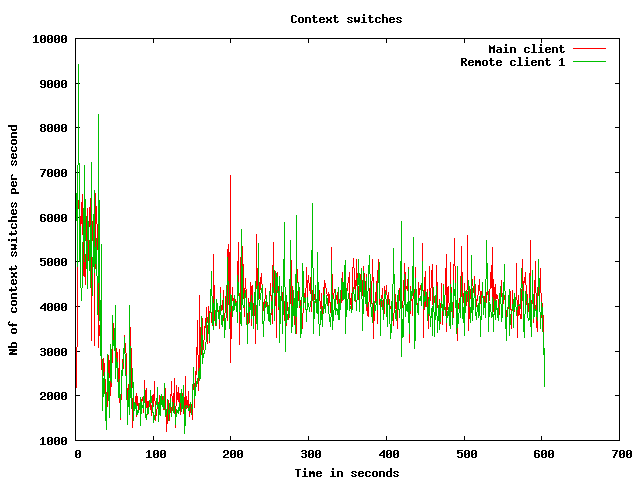
Processes usage graphs
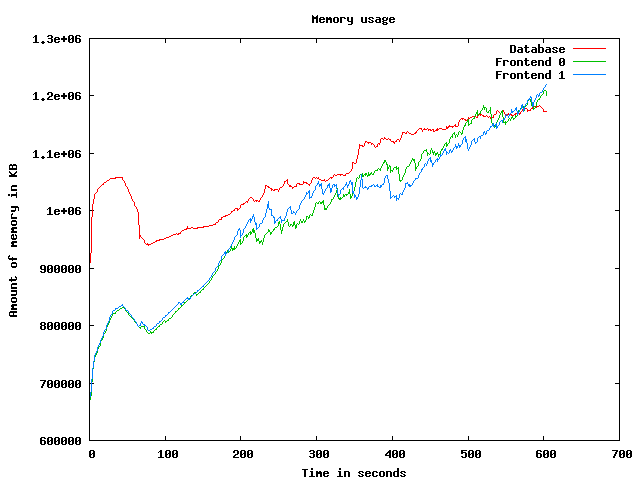
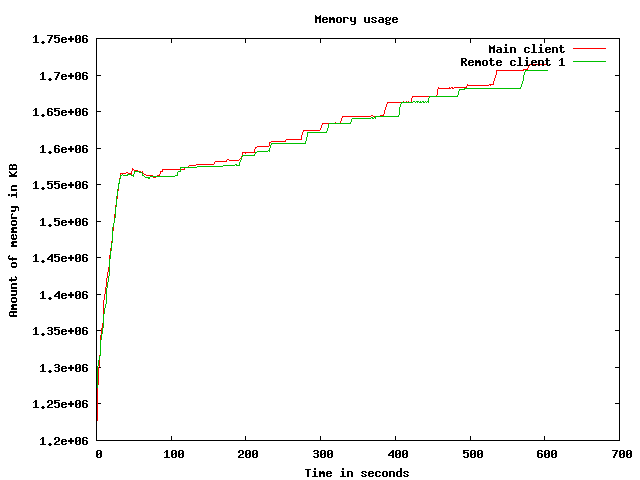
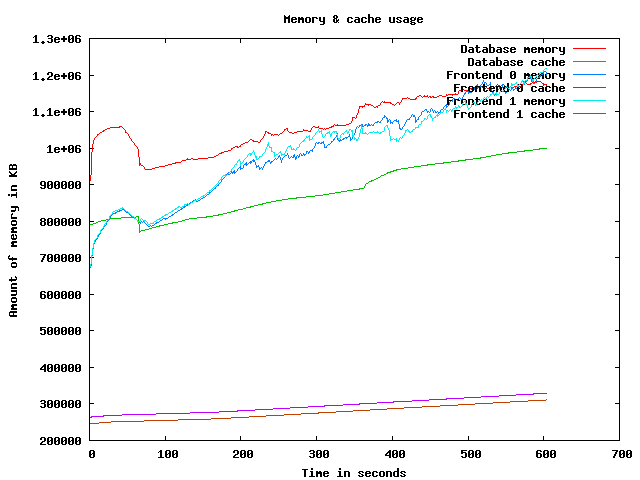
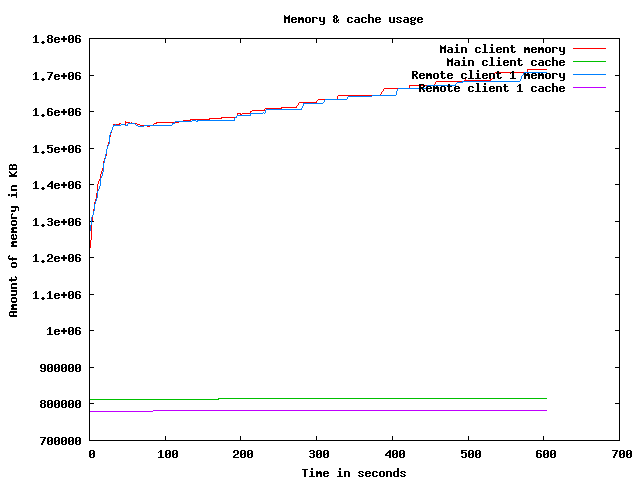
Memory usage graph
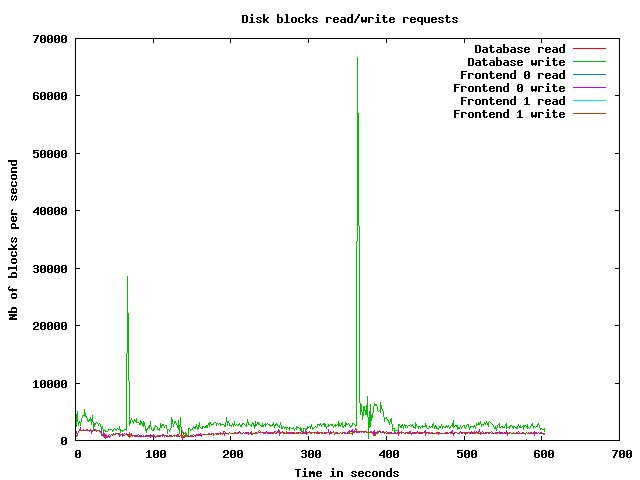
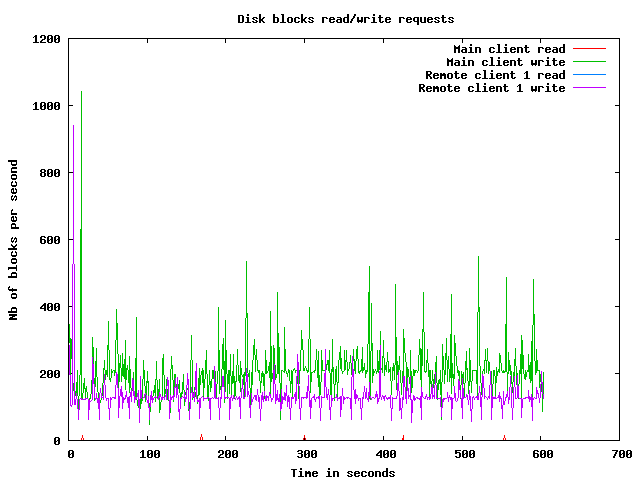
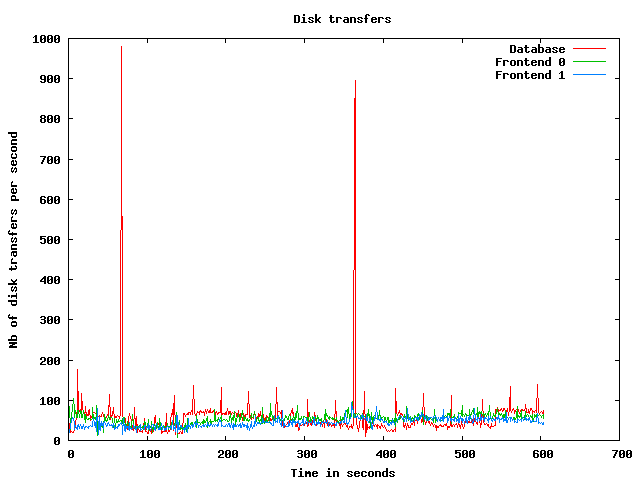
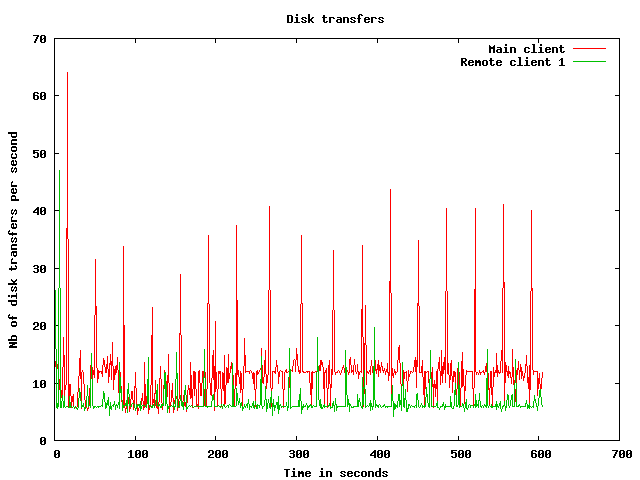
Disk usage graphs
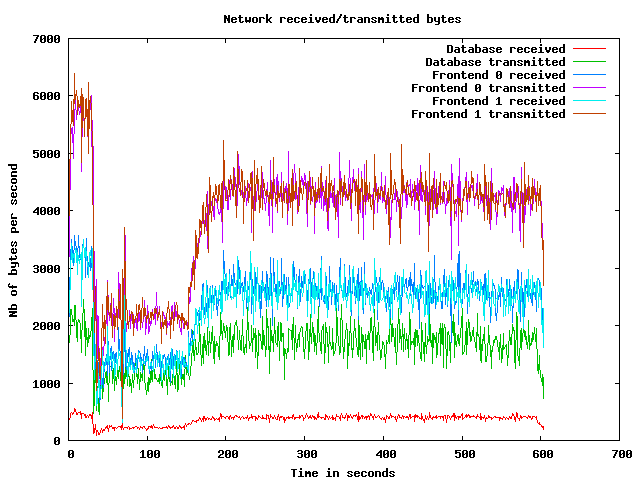
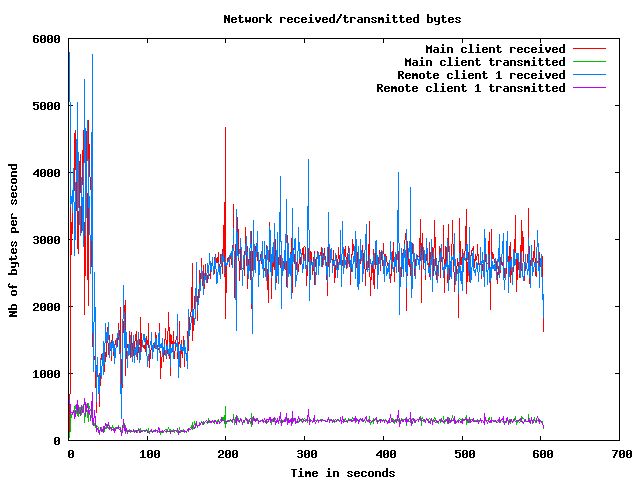
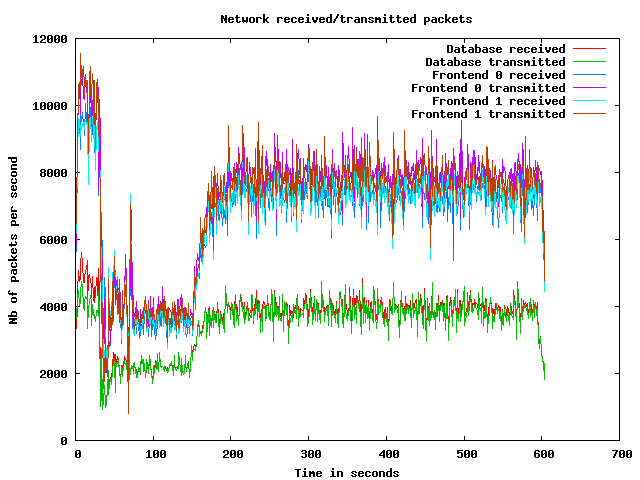
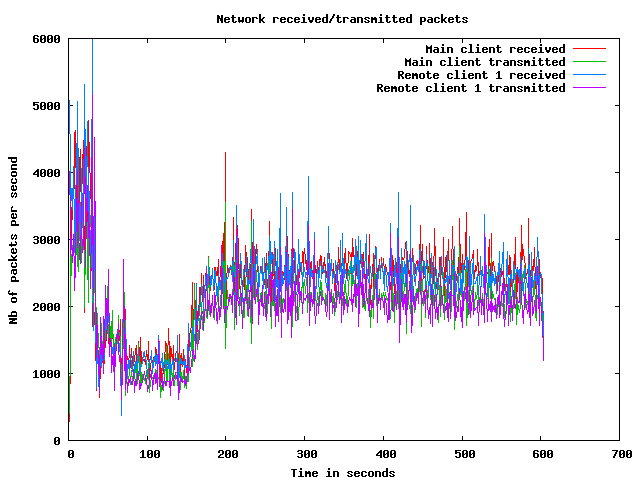
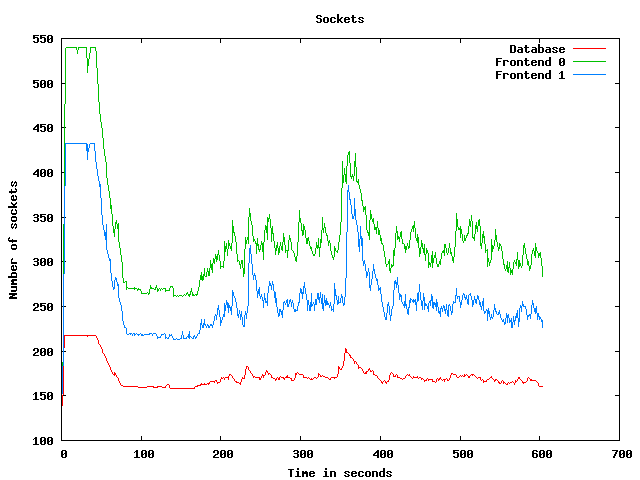
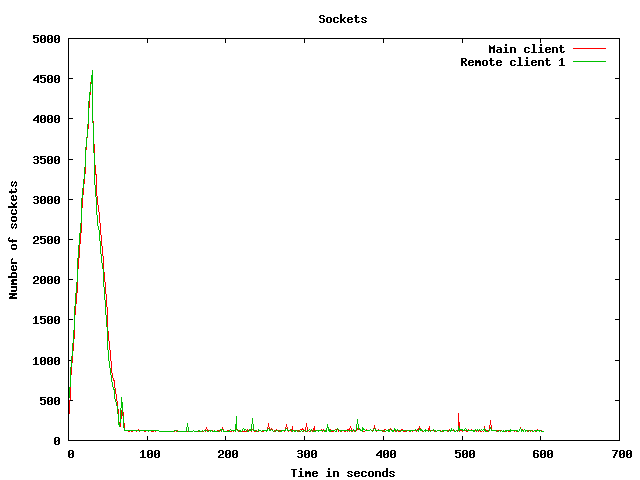
Network usage graphs
| Test start | 2009-3-20 5:31:15 |
| Up ramp start | 2009-3-20 5:31:47 |
| Runtime session start | 2009-3-20 5:33:47 |
| Down ramp start | 2009-3-20 5:41:17 |
| Test end | 2009-3-20 5:43:54 |
| Up ramp length | 2 minutes 0 millisecond (requested 120000 ms) |
| Runtime session length | 7 minutes 30 seconds 0 millisecond (requested 450000 ms) |
| Down ramp length | 30 seconds 1 millisecond (requested 30000 ms) |
| Total test length | 12 minutes 39 seconds 258 milliseconds |
| State name | % of total | Count | Errors | Minimum Time | Maximum Time | Average Time |
|---|---|---|---|---|---|---|
Home | 9 % | 7508 | 0 | 0 ms | 46505 ms | 4737 ms
|
Register | 1 % | 1064 | 0 | 0 ms | 46510 ms | 1924 ms
|
RegisterUser | 1 % | 1002 | 1 | 5 ms | 45609 ms | 1895 ms
|
Browse | 9 % | 7473 | 0 | 0 ms | 56098 ms | 2287 ms
|
BrowseCategories | 6 % | 4902 | 0 | 3 ms | 59106 ms | 1782 ms
|
SearchItemsInCategory | 14 % | 11458 | 0 | 0 ms | 46512 ms | 1467 ms
|
BrowseRegions | 2 % | 2105 | 0 | 3 ms | 93017 ms | 2049 ms
|
BrowseCategoriesInRegion | 2 % | 1962 | 0 | 3 ms | 46501 ms | 1702 ms
|
SearchItemsInRegion | 4 % | 3804 | 0 | 0 ms | 46509 ms | 1310 ms
|
ViewItem | 12 % | 9827 | 0 | 3 ms | 93214 ms | 1323 ms
|
ViewUserInfo | 2 % | 1831 | 0 | 3 ms | 46491 ms | 1108 ms
|
ViewBidHistory | 1 % | 827 | 0 | 3 ms | 46580 ms | 1328 ms
|
BuyNowAuth | 1 % | 906 | 0 | 2 ms | 93025 ms | 1447 ms
|
BuyNow | 1 % | 803 | 133 | 3 ms | 93037 ms | 1151 ms
|
StoreBuyBow | 0 % | 581 | 0 | 4 ms | 45034 ms | 782 ms
|
PutBidAuth | 4 % | 3225 | 0 | 0 ms | 45364 ms | 1325 ms
|
PutBid | 4 % | 3174 | 455 | 3 ms | 45440 ms | 1171 ms
|
StoreBid | 2 % | 1825 | 0 | 4 ms | 46555 ms | 1177 ms
|
PutCommentAuth | 0 % | 0 | 0 | 0 ms | 0 ms | 0 ms
|
PutComment | 0 % | 265 | 23 | 3 ms | 45023 ms | 1062 ms
|
StoreComment | 0 % | 221 | 0 | 5 ms | 45009 ms | 1200 ms
|
Sell | 0 % | 527 | 0 | 0 ms | 45100 ms | 2537 ms
|
SelectCategoryToSellItem | 0 % | 487 | 0 | 3 ms | 46490 ms | 1301 ms
|
SellItemForm | 0 % | 457 | 0 | 2 ms | 45089 ms | 1873 ms
|
RegisterItem | 0 % | 420 | 0 | 4 ms | 45070 ms | 1760 ms
|
AboutMe (auth form) | 2 % | 1686 | 0 | 0 ms | 46478 ms | 2224 ms
|
AboutMe | 2 % | 2325 | 0 | 4 ms | 46605 ms | 1585 ms
|
Back probability | 7 % | 5996 | 0 | 0 ms | 0 ms | 0 ms
|
End of Session | 1 % | 856 | 0 | 0 ms | 0 ms | 0 ms
|
Total | 100 % | 77517 | 612 | - | - | 1732 ms
|
Average throughput | 651 req/s
| |||||
Completed sessions | 793
| |||||
Total time | 40905 seconds
| |||||
Average session time | 51 seconds
| |||||
| State name | % of total | Count | Errors | Minimum Time | Maximum Time | Average Time |
|---|---|---|---|---|---|---|
Home | 4 % | 14962 | 0 | 0 ms | 866 ms | 3 ms
|
Register | 1 % | 3542 | 0 | 0 ms | 808 ms | 7 ms
|
RegisterUser | 1 % | 3454 | 14 | 5 ms | 748 ms | 27 ms
|
Browse | 7 % | 23818 | 0 | 0 ms | 904 ms | 7 ms
|
BrowseCategories | 4 % | 16598 | 0 | 3 ms | 3044 ms | 19 ms
|
SearchItemsInCategory | 15 % | 51856 | 0 | 0 ms | 3082 ms | 20 ms
|
BrowseRegions | 2 % | 6928 | 0 | 3 ms | 580 ms | 17 ms
|
BrowseCategoriesInRegion | 2 % | 6813 | 0 | 3 ms | 753 ms | 19 ms
|
SearchItemsInRegion | 5 % | 16833 | 0 | 0 ms | 3205 ms | 40 ms
|
ViewItem | 14 % | 47167 | 0 | 3 ms | 3096 ms | 26 ms
|
ViewUserInfo | 3 % | 10595 | 0 | 3 ms | 891 ms | 24 ms
|
ViewBidHistory | 1 % | 5604 | 0 | 3 ms | 829 ms | 51 ms
|
BuyNowAuth | 1 % | 4467 | 0 | 2 ms | 742 ms | 12 ms
|
BuyNow | 1 % | 4417 | 677 | 4 ms | 651 ms | 27 ms
|
StoreBuyBow | 1 % | 3707 | 0 | 5 ms | 900 ms | 25 ms
|
PutBidAuth | 4 % | 16637 | 0 | 0 ms | 2996 ms | 11 ms
|
PutBid | 5 % | 19020 | 2312 | 0 ms | 3056 ms | 29 ms
|
StoreBid | 3 % | 12311 | 3 | 4 ms | 888 ms | 25 ms
|
PutCommentAuth | 0 % | 0 | 0 | 0 ms | 0 ms | 0 ms
|
PutComment | 0 % | 1627 | 118 | 4 ms | 871 ms | 25 ms
|
StoreComment | 0 % | 1488 | 0 | 5 ms | 738 ms | 25 ms
|
Sell | 0 % | 1810 | 0 | 0 ms | 683 ms | 7 ms
|
SelectCategoryToSellItem | 0 % | 1786 | 0 | 3 ms | 857 ms | 25 ms
|
SellItemForm | 0 % | 1741 | 0 | 2 ms | 864 ms | 12 ms
|
RegisterItem | 0 % | 1710 | 0 | 4 ms | 503 ms | 22 ms
|
AboutMe (auth form) | 1 % | 5543 | 0 | 0 ms | 748 ms | 7 ms
|
AboutMe | 2 % | 9373 | 0 | 4 ms | 3178 ms | 60 ms
|
Back probability | 10 % | 34266 | 0 | 0 ms | 0 ms | 0 ms
|
End of Session | 1 % | 4835 | 0 | 0 ms | 0 ms | 0 ms
|
Total | 100 % | 332908 | 3124 | - | - | 19 ms
|
Average throughput | 746 req/s
| |||||
Completed sessions | 4833
| |||||
Total time | 1225812 seconds
| |||||
Average session time | 253 seconds
| |||||
| State name | % of total | Count | Errors | Minimum Time | Maximum Time | Average Time |
|---|---|---|---|---|---|---|
Home | 4 % | 485 | 0 | 0 ms | 39 ms | 0 ms
|
Register | 1 % | 123 | 0 | 0 ms | 43 ms | 1 ms
|
RegisterUser | 1 % | 121 | 0 | 5 ms | 70 ms | 11 ms
|
Browse | 6 % | 759 | 0 | 0 ms | 20 ms | 1 ms
|
BrowseCategories | 4 % | 533 | 0 | 3 ms | 61 ms | 8 ms
|
SearchItemsInCategory | 15 % | 1746 | 0 | 3 ms | 98 ms | 8 ms
|
BrowseRegions | 1 % | 210 | 0 | 3 ms | 40 ms | 7 ms
|
BrowseCategoriesInRegion | 1 % | 219 | 0 | 3 ms | 41 ms | 8 ms
|
SearchItemsInRegion | 5 % | 564 | 0 | 0 ms | 203 ms | 17 ms
|
ViewItem | 14 % | 1549 | 0 | 3 ms | 140 ms | 12 ms
|
ViewUserInfo | 3 % | 336 | 0 | 3 ms | 61 ms | 11 ms
|
ViewBidHistory | 1 % | 175 | 0 | 3 ms | 169 ms | 26 ms
|
BuyNowAuth | 1 % | 145 | 0 | 2 ms | 41 ms | 4 ms
|
BuyNow | 1 % | 136 | 11 | 4 ms | 56 ms | 11 ms
|
StoreBuyBow | 1 % | 117 | 0 | 4 ms | 55 ms | 12 ms
|
PutBidAuth | 4 % | 540 | 0 | 0 ms | 54 ms | 4 ms
|
PutBid | 5 % | 622 | 78 | 4 ms | 77 ms | 14 ms
|
StoreBid | 3 % | 432 | 0 | 4 ms | 86 ms | 10 ms
|
PutCommentAuth | 0 % | 0 | 0 | 0 ms | 0 ms | 0 ms
|
PutComment | 0 % | 48 | 4 | 4 ms | 39 ms | 12 ms
|
StoreComment | 0 % | 45 | 0 | 5 ms | 40 ms | 8 ms
|
Sell | 0 % | 63 | 0 | 0 ms | 4 ms | 0 ms
|
SelectCategoryToSellItem | 0 % | 66 | 0 | 4 ms | 42 ms | 11 ms
|
SellItemForm | 0 % | 74 | 0 | 2 ms | 18 ms | 4 ms
|
RegisterItem | 0 % | 78 | 0 | 5 ms | 27 ms | 6 ms
|
AboutMe (auth form) | 1 % | 189 | 0 | 0 ms | 39 ms | 1 ms
|
AboutMe | 2 % | 288 | 0 | 4 ms | 113 ms | 31 ms
|
Back probability | 10 % | 1176 | 0 | 0 ms | 0 ms | 0 ms
|
End of Session | 1 % | 178 | 0 | 0 ms | 0 ms | 0 ms
|
Total | 100 % | 11017 | 93 | - | - | 8 ms
|
Average throughput | 370 req/s
| |||||
Completed sessions | 168
| |||||
Total time | 58118 seconds
| |||||
Average session time | 345 seconds
| |||||
| State name | % of total | Count | Errors | Minimum Time | Maximum Time | Average Time |
|---|---|---|---|---|---|---|
Home | 5 % | 22955 | 0 | 0 ms | 46505 ms | 1551 ms
|
Register | 1 % | 4729 | 0 | 0 ms | 46510 ms | 438 ms
|
RegisterUser | 1 % | 4577 | 15 | 5 ms | 45609 ms | 436 ms
|
Browse | 7 % | 32050 | 0 | 0 ms | 56098 ms | 539 ms
|
BrowseCategories | 5 % | 22033 | 0 | 3 ms | 59106 ms | 411 ms
|
SearchItemsInCategory | 15 % | 65328 | 0 | 0 ms | 46512 ms | 274 ms
|
BrowseRegions | 2 % | 9243 | 0 | 3 ms | 93017 ms | 480 ms
|
BrowseCategoriesInRegion | 2 % | 8994 | 0 | 3 ms | 46501 ms | 386 ms
|
SearchItemsInRegion | 5 % | 21246 | 0 | 0 ms | 46509 ms | 267 ms
|
ViewItem | 13 % | 58643 | 0 | 3 ms | 93214 ms | 243 ms
|
ViewUserInfo | 3 % | 12791 | 0 | 3 ms | 46491 ms | 179 ms
|
ViewBidHistory | 1 % | 6623 | 0 | 3 ms | 46580 ms | 210 ms
|
BuyNowAuth | 1 % | 5518 | 0 | 2 ms | 93025 ms | 248 ms
|
BuyNow | 1 % | 5356 | 821 | 3 ms | 93037 ms | 195 ms
|
StoreBuyBow | 1 % | 4405 | 0 | 4 ms | 45034 ms | 125 ms
|
PutBidAuth | 4 % | 20402 | 0 | 0 ms | 45364 ms | 219 ms
|
PutBid | 5 % | 22866 | 2845 | 0 ms | 45440 ms | 187 ms
|
StoreBid | 3 % | 14568 | 3 | 4 ms | 46555 ms | 169 ms
|
PutCommentAuth | 0 % | 0 | 0 | 0 ms | 0 ms | 0 ms
|
PutComment | 0 % | 1940 | 145 | 3 ms | 45023 ms | 166 ms
|
StoreComment | 0 % | 1754 | 0 | 5 ms | 45009 ms | 172 ms
|
Sell | 0 % | 2400 | 0 | 0 ms | 45100 ms | 562 ms
|
SelectCategoryToSellItem | 0 % | 2339 | 0 | 3 ms | 46490 ms | 290 ms
|
SellItemForm | 0 % | 2272 | 0 | 2 ms | 45089 ms | 386 ms
|
RegisterItem | 0 % | 2208 | 0 | 4 ms | 45070 ms | 352 ms
|
AboutMe (auth form) | 1 % | 7418 | 0 | 0 ms | 46478 ms | 510 ms
|
AboutMe | 2 % | 12052 | 0 | 4 ms | 46605 ms | 353 ms
|
Back probability | 9 % | 41439 | 0 | 0 ms | 0 ms | 0 ms
|
End of Session | 1 % | 5869 | 0 | 0 ms | 0 ms | 0 ms
|
Total | 100 % | 422018 | 3829 | - | - | 333 ms
|
Average throughput | 709 req/s
| |||||
Completed sessions | 5869
| |||||
Total time | 1350503 seconds
| |||||
Average session time | 230 seconds
| |||||
An error occured while waiting for remote processes termination (Skipping waits)
Command is: /usr/bin/scp farm6.csail.mit.edu:/tmp/client1 /home/drkp/sandbox/txcache/src/RUBiS-1.4.3/bench/2009-3-20@5:31:15//client1.bin
Command is: /usr/bin/ssh -x localhost /bin/bash -c 'LANG=en_GB.UTF-8 /usr/bin/sar -n DEV -n SOCK -rubcw 1 605 -f /home/drkp/sandbox/txcache/src/RUBiS-1.4.3/bench/2009-3-20@5:31:15//client1.bin > /home/drkp/sandbox/txcache/src/RUBiS-1.4.3/bench/2009-3-20@5:31:15//client1'
Command is: /usr/bin/scp farm14:/tmp/db_server0 /home/drkp/sandbox/txcache/src/RUBiS-1.4.3/bench/2009-3-20@5:31:15//db_server0.bin
Command is: /usr/bin/ssh -x localhost /bin/bash -c 'LANG=en_GB.UTF-8 /usr/bin/sar -n DEV -n SOCK -rubcw 1 605 -f /home/drkp/sandbox/txcache/src/RUBiS-1.4.3/bench/2009-3-20@5:31:15//db_server0.bin > /home/drkp/sandbox/txcache/src/RUBiS-1.4.3/bench/2009-3-20@5:31:15//db_server0'
Command is: /usr/bin/scp farm12.csail.mit.edu:/tmp/web_server0 /home/drkp/sandbox/txcache/src/RUBiS-1.4.3/bench/2009-3-20@5:31:15//web_server0.bin
Command is: /usr/bin/ssh -x localhost /bin/bash -c 'LANG=en_GB.UTF-8 /usr/bin/sar -n DEV -n SOCK -rubcw 1 605 -f /home/drkp/sandbox/txcache/src/RUBiS-1.4.3/bench/2009-3-20@5:31:15//web_server0.bin > /home/drkp/sandbox/txcache/src/RUBiS-1.4.3/bench/2009-3-20@5:31:15//web_server0'
Command is: /usr/bin/scp farm13.csail.mit.edu:/tmp/web_server1 /home/drkp/sandbox/txcache/src/RUBiS-1.4.3/bench/2009-3-20@5:31:15//web_server1.bin
Command is: /usr/bin/ssh -x localhost /bin/bash -c 'LANG=en_GB.UTF-8 /usr/bin/sar -n DEV -n SOCK -rubcw 1 605 -f /home/drkp/sandbox/txcache/src/RUBiS-1.4.3/bench/2009-3-20@5:31:15//web_server1.bin > /home/drkp/sandbox/txcache/src/RUBiS-1.4.3/bench/2009-3-20@5:31:15//web_server1'
Command is: /usr/bin/scp localhost:/tmp/client0 /home/drkp/sandbox/txcache/src/RUBiS-1.4.3/bench/2009-3-20@5:31:15//client0.bin
Command is: /usr/bin/ssh -x localhost /bin/bash -c 'LANG=en_GB.UTF-8 /usr/bin/sar -n DEV -n SOCK -rubcw 1 605 -f /home/drkp/sandbox/txcache/src/RUBiS-1.4.3/bench/2009-3-20@5:31:15//client0.bin > /home/drkp/sandbox/txcache/src/RUBiS-1.4.3/bench/2009-3-20@5:31:15//client0'
Command is: /usr/bin/scp farm6.csail.mit.edu:/tmp/trace_client1.html /home/drkp/sandbox/txcache/src/RUBiS-1.4.3/bench/2009-3-20@5:31:15//
Command is: /usr/bin/scp farm6.csail.mit.edu:/tmp/stat_client1.html /home/drkp/sandbox/txcache/src/RUBiS-1.4.3/bench/2009-3-20@5:31:15//
|
|
|
|
|
|
 | 
|
 | 
|
 | 
|
 | 
|
 | 
|
 | 
|
 | 
|
 | 
|
 | 
|